Try it on your own data
Every report in this article is in the free plan. One snippet for web and apps, up to 10 sites.
Start freeROAS = revenue from ads ÷ ad spend, so $20,000 of ad revenue on $5,000 of spend is 4.0, or 400%. But ROAS measures revenue, not profit: you only know whether you made money after comparing it with a break-even ROAS of 1 ÷ gross margin. At a 35% margin that is 2.86, and at 20% it is 5.0.
What you will learn
- ROAS = ad revenue ÷ ad spend; express it as 4.0 or 400%, not both in one sentence
- Break-even ROAS = 1 ÷ gross margin, so a ROAS of 4.0 can profit at 35% margin and lose at 20%
- Rank campaigns by gross profit after ads, and never add platform-reported revenue together
What is ROAS, and how do you calculate it?
ROAS, return on ad spend, is the revenue your ads brought in divided by what you spent on them:
ROAS = revenue from ads ÷ ad spend
Spend $5,000 on a campaign that brings in $20,000 of sales and ROAS is 20,000 ÷ 5,000 = 4.0, written 4:1 or 4x. Multiply by 100 to express it as a percentage: 400%. Google Ads' help page uses the percentage form: $5 in sales ÷ $1 in ad spend × 100% = 500%. The two forms are the same number, and mixing them up is a common source of mistakes (a target of 3.0 is 300%, not 3%).
Here is the part the formula leaves out. ROAS measures revenue, not profit, so it only tells you whether you made money after you convert it with your margin. A 4.0 can lose money on a thin-margin product and a 2.0 can be very profitable on a high-margin one. The next sections show how to compute the break-even ROAS, run the numbers on three campaigns, and avoid the traps in attributing revenue to ads. The broader concept of return on investment sits on the ROI and ROAS glossary page, and the margin side is explained in gross margin.
The ROAS formula in four steps
- Choose the period and the scope. One campaign for a month, or all paid channels for a quarter. Use the same period for spend and revenue.
- Total the ad spend. Include everything you paid the platform. Add agency fees and creative costs if you want a stricter version, and say so.
- Total the revenue attributed to those ads. This is the hardest number, because it depends on how revenue is credited to ads (more on that below).
- Divide, then express it. Revenue ÷ spend, as a ratio (4.0) or a percentage (400%).
A profit-adjusted version that some teams use is (revenue − cost of goods sold) ÷ ad spend. It folds margin into ROAS so that 1.0 is break-even, but it is no longer comparable with the standard figure on platform dashboards, so label it clearly. The approach in this guide keeps the standard ROAS and compares it with a break-even value.
Two related checks use the same inputs: cost per click is spend ÷ clicks, and PPC analysis looks at the click-to-sale path. You can also try your own numbers in the ROAS calculator.
Break-even ROAS: the number that tells you whether you made money
Break-even ROAS is the lowest ROAS at which the gross profit on the ad-driven revenue just covers the ad spend:
Break-even ROAS = 1 ÷ gross margin
Derivation: with gross margin m, each $1 of revenue earns $m of gross profit, so you need revenue × m = spend, which means revenue ÷ spend = 1 ÷ m.
Take the $5,000 campaign that returned $20,000 and assume a 35% gross margin:
- Break-even ROAS: 1 ÷ 0.35 = 2.86.
- Actual ROAS: 4.0, which clears break-even by 1.14.
- Gross profit on the revenue: 20,000 × 0.35 = $7,000.
- Gross profit after ad spend: 7,000 − 5,000 = $2,000.
- Return on the ad budget (profit ÷ spend): 2,000 ÷ 5,000 = 40%.
At a 25% margin the break-even would be 1 ÷ 0.25 = 4.0, and the same campaign would earn nothing. That is why a single "good ROAS" figure does not exist: it depends on the margin. Use contribution margin, meaning revenue less product cost, shipping, payment fees and returns, when you have it, because gross margin alone flatters the result.
| Gross margin | Break-even ROAS | Spend $5,000: revenue needed to break even |
|---|---|---|
| 20% | 5.00 | $25,000 |
| 25% | 4.00 | $20,000 |
| 35% | 2.86 | $14,286 |
| 50% | 2.00 | $10,000 |
| 60% | 1.67 | $8,333 |
Break-even ROAS = 1 ÷ gross margin; revenue needed = spend × break-even ROAS. Use contribution margin when you have it.
Three campaigns, one budget: why the highest ROAS is not the winner
Sample data: three campaigns selling different products, each with its own margin.
| Campaign | Spend | Revenue | ROAS | Gross margin | Break-even ROAS | Gross profit after ads |
|---|---|---|---|---|---|---|
| A: accessories | $2,000 | $7,000 | 3.5 | 50% | 2.0 | 7,000 × 0.50 − 2,000 = $1,500 |
| B: premium line | $1,500 | $3,750 | 2.5 | 60% | 1.67 | 3,750 × 0.60 − 1,500 = $750 |
| C: clearance | $1,500 | $6,000 | 4.0 | 20% | 5.0 | 6,000 × 0.20 − 1,500 = −$300 |
| Total | $5,000 | $16,750 | 3.35 | n/a | n/a | $1,950 |
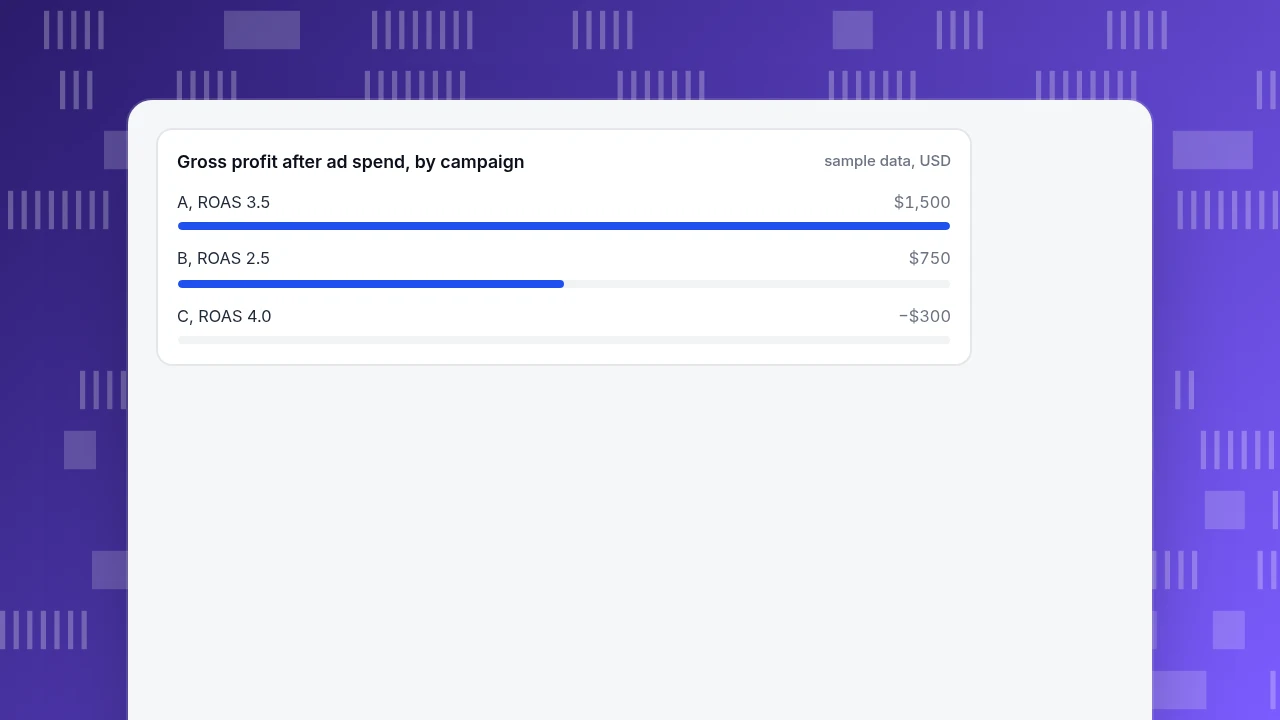
Campaign C has the highest ROAS (4.0) and the only loss, because a 20% margin needs a ROAS of 5.0 just to break even. Campaign B has the lowest ROAS (2.5) and a profit, because at a 60% margin its break-even is only 1.67. A report sorted by ROAS would tell you to move the budget to C and cut B, which is the wrong way round.
The decision rule is: compare each campaign's ROAS with its own break-even ROAS, and rank by gross profit after ads, not by ROAS. If a campaign sits between break-even and the target you have set, it is covering costs but not growing profit; below break-even, it is paying to sell.
Gross profit after ad spend, by campaign
sample data, USDROAS and ROI are not the same thing
ROAS divides revenue by spend. ROI divides profit by cost:
ROI = (revenue × margin − spend) ÷ spend
For the $5,000 campaign at 35% margin, ROAS is 4.0 (400%) while the ad-level ROI is (7,000 − 5,000) ÷ 5,000 = 40%. Same campaign, a 10x difference in the headline, because one number is revenue and the other is profit.
Use ROAS to steer ad channels day to day, since revenue and spend are both reported right away. Use ROI when you need to defend the budget, because it includes margin. Wider business ROI, with salaries and tools, is covered in marketing ROI, and you can run it in the marketing ROI calculator.
Platform ROAS and blended ROAS
The revenue in the ROAS formula comes from somewhere, and where it comes from changes the answer.
- Platform ROAS uses the conversions the ad platform reports. Each platform credits its own ads using its own attribution model and window; Google's help describes data-driven attribution as giving credit based on how people engage with the ads on its networks.
- Blended ROAS is total store revenue ÷ total ad spend across all channels. It ignores credit disputes, and it counts revenue that would have happened without ads.
Sample data shows the problem. Meta reports $9,000 on $4,000 of spend (ROAS 2.25). Google reports $12,000 on $3,000 (ROAS 4.0). Added together, the platforms claim 21,000 ÷ 7,000 = 3.0. The store's total revenue for the period was $16,000, which caps what the ads could have brought in: 16,000 ÷ 7,000 = 2.29 as an upper bound. The platforms together claim $5,000 more than the store earned, so some orders were claimed twice.
The rule: never add platform-reported revenue together. Take blended ROAS as the ceiling, and use platform ROAS for relative comparisons inside one platform. If the two disagree widely, see data discrepancies.
What is a good ROAS?
A good ROAS is one that clears your break-even with room to grow profit. It depends on three things you control:
- Margin. From the formula: 60% margin breaks even at 1.67, 20% margin at 5.0.
- Goal. New-customer acquisition can accept a ROAS near break-even if repeat purchases follow; a clearance sale needs a margin of safety.
- Time frame. Revenue from the same customers over the following months raises the effective return beyond the first order.
Do not borrow a number from a blog post. Compute your break-even, add the profit you want, and use that as the target: if you need a 25% return on spend at a 35% margin, target ROAS = (1 + 0.25) ÷ 0.35 = 3.57.
Common mistakes
- Reading ROAS as profit. Revenue is not money kept. Convert it with margin.
- Using one target for every product. A single ROAS target hides which campaigns lose money.
- Adding platform revenue together. The sum can exceed the store's revenue.
- Mixing periods. Spend from this month against revenue from conversions that closed next month.
- Ignoring returns and discounts. Revenue after refunds, not at the order date, is what your ads earned.
- Chasing a higher ratio by cutting spend. ROAS often rises as spend falls because only the best clicks remain, while total profit drops. Watch the profit amount, not just the ratio.
How to calculate ROAS in TapCub
Let us rebuild the three-campaign table with your own numbers:
- Open All-platform analytics › Business › Channel ROI and go to the Costs tab. Click Add one for each row, or import a CSV with columns
day,channel,source,campaign,cost,currency,clicksandimpressions;dayandcostare required. Importing the same day, channel, source and campaign again overwrites the row instead of adding to it. Adding or importing costs needs an owner or admin. - Switch to the ROI tab and group by channel, source or campaign. TapCub shows cost per click (spend ÷ sessions), cost per acquisition (spend ÷ purchases on the order ledger) and return on ad spend (revenue ÷ spend, where revenue is the order amount in the base currency). Spend in another currency is converted at that day's rate.
- Read each campaign's ROAS next to its break-even from your own margin (1 ÷ margin). TapCub's revenue is the order amount, not profit, so the margin step is yours to apply, as in the table above.
- Where spend is blank, the page asks you to import costs; with no orders on the ledger, revenue is zero and no return is estimated.
TapCub does not buy or optimise ads; it records what you spent and what came back. Because the revenue comes from your own order ledger rather than from each ad platform's report, it is closer to the blended view than to platform-reported ROAS.
FAQ
How do you calculate ROAS?
Divide the revenue from ads by the ad spend. $20,000 of ad-driven revenue on $5,000 of spend is 4.0, or 400% as a percentage. Use the same period for both numbers.
What is the ROAS formula as a percentage?
ROAS % = (revenue from ads ÷ ad spend) × 100. A ratio of 4.0 equals 400%. Google Ads' help page writes it the same way: $5 in sales ÷ $1 in ad spend × 100% = 500%.
What is break-even ROAS?
The ROAS at which gross profit equals ad spend: 1 ÷ gross margin. At a 35% margin it is 2.86; at 20% it is 5.0. Below that value the ads lose money, however high the ratio looks.
What is the difference between ROAS and ROI?
ROAS is revenue ÷ spend; ROI is (profit − spend) ÷ spend with profit measured at margin. For $20,000 of revenue on $5,000 of spend at a 35% margin, ROAS is 400% and the ad-level ROI is 40%.
What is a good ROAS?
One that clears your break-even and meets your profit target. At a 35% margin and a 25% target return on spend, the target is (1 + 0.25) ÷ 0.35 = 3.57. Calculate yours instead of borrowing a benchmark.
See also: PPC Reports: How to Build One From Spend to Sale.
See also: PPC Dashboard: The Metrics, Formulas and Layout That Drive Decisions.
Sources
Was this article helpful?
We use your answers to fix and expand this page.
Couldn’t send. Please try again in a minute.
Thanks for the feedback. We’ll use it to improve this page.You’ve already sent feedback on this page. Thanks.

Product Adoption Consultant
Explores customer onboarding, live conversations, and self-service, turning common usage questions into practical guidance and improvements.