Try it on your own data
Every report in this article is in the free plan. One snippet for web and apps, up to 10 sites.
Start freeA PPC report should run from spend to sale: what you spent, what it brought and whether it was worth it. Chain spend, clicks, orders, revenue and contribution after margin, show campaigns separately, reconcile with your analytics and end with decisions. Below: the chain, a three-campaign example, why numbers differ and a one-page format.
What you will learn
- Run the report from spend to sale and end with contribution after margin, not just revenue
- Compare each campaign with break-even ROAS (1 ÷ margin); a good total can hide a losing campaign
- State platform and analytics numbers both, with the usual ratio between them
What is a PPC report, and who reads it?
A PPC report summarises what a pay-per-click advertising programme spent and what that spend produced, over a set period. Its readers want different things from the same numbers, which is why most reports end up too long for one and too thin for another:
| Reader | The question they bring | What they need on the page |
|---|---|---|
| Executive or owner | Is this worth it? | Spend, revenue, return, profit, one recommendation |
| Channel manager | What should I change? | Campaign-level cost, conversion and return |
| Finance | Does this reconcile? | Spend that matches invoices, revenue that matches orders |
The thesis of this article: a PPC report should run from spend to sale: what you spent, what it brought and whether it was worth it. Impressions and click-through rate belong in the manager's section, not the headline. The detailed analysis of campaigns is in PPC analysis, the return formula in how to calculate ROAS and the wider view in marketing ROI. This guide is about assembling one honest page from those.
Which numbers belong in a PPC report, and in what order?
Build the report as a chain where each line is derived from the previous one. Readers can then see where money is lost:
| Line | Formula | Question it answers |
|---|---|---|
| Spend | From the ad platform and invoices | What did we pay? |
| Clicks | From the ad platform | How many people did we pay for? |
| Cost per click | Spend ÷ clicks | How expensive is attention? |
| Sessions | From your analytics | How many arrived? |
| Conversion rate | Orders ÷ sessions (or clicks) | Did they do what we want? |
| Cost per order | Spend ÷ orders | What did each result cost? |
| Revenue | Orders × order value | What came back? |
| Return on ad spend | Revenue ÷ spend | How many dollars per dollar? |
| Contribution after ads | Revenue × gross margin − spend | Did we make money? |
The last line is the one finance cares about, and many reports skip it. Revenue is not profit: a return of 3.0 on a product with a 40% margin is $1.20 of gross profit per $1.00 of spend, a $0.20 gain before any other cost. The break-even return is 1 ÷ margin: 1 ÷ 0.40 = 2.5. For the ad platform's own definition of the target, see Target ROAS: the average conversion value (for example, revenue) you want for each dollar you spend on ads.
| Line | Formula | Answers |
|---|---|---|
| Cost per click | Spend ÷ clicks | How expensive is attention? |
| Cost per order | Spend ÷ orders | What did each result cost? |
| ROAS | Revenue ÷ spend | Dollars back per dollar |
| Contribution after ads | Revenue × margin − spend | Did we make money? |
| Break-even ROAS | 1 ÷ gross margin | Where does a campaign stop paying? |
At a 40% margin, break-even ROAS is 2.5.
What does a monthly PPC report look like in numbers?
Sample data: one month, three campaigns, 40% gross margin.
| Campaign | Spend | Clicks | CPC | Orders | Cost per order | Revenue | ROAS | Contribution after ads |
|---|---|---|---|---|---|---|---|---|
| Branded search | $2,000 | 4,000 | $0.50 | 200 | $10.00 | $20,000 | 10.0 | +$6,000 |
| Non-brand search | $9,000 | 6,000 | $1.50 | 180 | $50.00 | $27,000 | 3.0 | +$1,800 |
| Prospecting social | $5,000 | 10,000 | $0.50 | 50 | $100.00 | $6,000 | 1.2 | −$2,600 |
| Total | $16,000 | 20,000 | $0.80 | 430 | $37.21 | $53,000 | 3.31 | +$5,200 |
How each cell is derived: branded search, 4,000 × $0.50 = $2,000 spend, 200 ÷ 4,000 = 5% conversion, $20,000 ÷ $2,000 = 10.0, $20,000 × 0.40 − $2,000 = +$6,000. Non-brand: $27,000 × 0.40 − $9,000 = +$1,800. Social: $6,000 × 0.40 − $5,000 = −$2,600. Total revenue $20,000 + $27,000 + $6,000 = $53,000; ROAS 53,000 ÷ 16,000 = 3.31; cost per order 16,000 ÷ 430 = $37.21; contribution 6,000 + 1,800 − 2,600 = +$5,200.
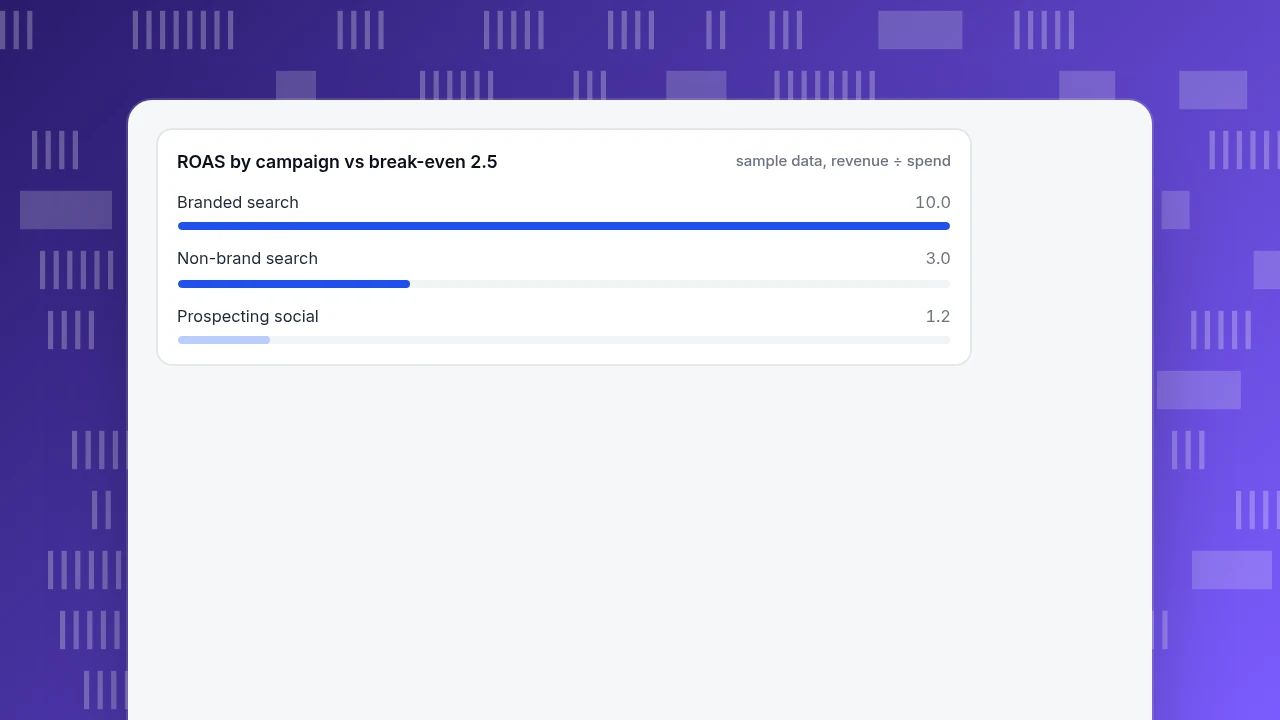
Reading it: the total ROAS of 3.31 clears the break-even of 2.5, which hides one campaign that does not. Prospecting social returns 1.2, below 2.5, and loses $2,600. Two cautions apply. Branded search looks superb at 10.0 because it captures people already looking for you, so some of that revenue would have arrived anyway: do not treat it as proof that spending more there would repeat it. And the margin, 40%, is an input you must take from finance, not guess.
ROAS by campaign vs break-even 2.5
sample data, revenue ÷ spendWhy do the platform's numbers differ from your analytics?
They will not match, and the report should say by how much and why. The usual causes:
- Clicks versus sessions. A click can fail to load, repeat or come from a bot; a session needs the page to load and the tracker to run.
- Attribution rules. The ad platform credits conversions to ads by its own window and model; your analytics may use last click or another rule.
- Conversion definitions. One counts a sign-up, the other an order.
- Time zones and reporting delays.
- Consent. Visitors who decline tracking appear in one system and not the other.
Sample data: the platform reports 20,000 clicks and your analytics 18,400 sessions: 18,400 ÷ 20,000 = 92%. The platform reports 430 orders and your analytics 361: 361 ÷ 430 = 84%. A report that states both numbers and a standing explanation ("analytics runs at about 92% of clicks and 84% of platform conversions because of load failures and last-click attribution") is more credible than one that quietly picks the larger. Tag every link so analytics can tell the campaigns apart: the standard parameters are utm_source, utm_medium and utm_campaign, with utm_term for paid keywords and utm_content to tell similar links apart (Analytics Help).
How should the report end?
A report with no recommendation is a record. Close with decisions, each tied to a number:
| Finding | Decision |
|---|---|
| ROAS below break-even (2.5) | Cut, restructure or cap the campaign; set a review date |
| ROAS above break-even but falling | Check conversion rate and cost per click first |
| One campaign carries the total | Test whether spend there is incremental before raising it |
| Cost per order rising | Look at click quality and landing page before bids |
| Platform and analytics diverge more than usual | Fix tagging before changing budgets |
In the example, the recommendation is to pause or restructure prospecting social, which moves $5,000 of budget, and to test non-brand search with a small increase while watching whether its cost per order of $50 holds.
Put a number on the recommendation. If prospecting social were paused and its orders vanished with it, with no effect on other campaigns, spend would fall to $16,000 − $5,000 = $11,000 and revenue to $53,000 − $6,000 = $47,000. Contribution would be $47,000 × 0.40 − $11,000 = $18,800 − $11,000 = $7,800, against $5,200 today: $2,600 better. The assumption of no spillover is the weak point, because prospecting can feed later branded searches. That is why the decision is to restructure and test, not simply to cut.
How long should a PPC report be, and how often?
One page, with the headline first:
- Headline: spend, revenue, ROAS, contribution after ads, compared with the previous period.
- Campaign table like the one above.
- What changed and why, in three sentences.
- Decisions with owners and dates.
- Appendix for the manager: impressions, click-through rate, keywords, creatives.
Review weekly for movement and report monthly for decisions. Weekly numbers on small spend jump around; do not draw conclusions from a single day.
Always show the previous period beside the current one, and where seasonality matters, the same period last year. A return of 3.31 means little alone; 3.31 against 2.80 last month and 3.60 a year ago tells the reader whether to worry.
What do people get wrong in PPC reports?
- Leading with impressions and clicks. Readers want money in and out.
- Reporting revenue as profit. Apply margin and show the break-even return.
- Hiding a losing campaign inside a good total. Show campaigns separately.
- Quoting branded return as the channel's return. It flatters the average.
- Picking whichever number is bigger. State both and the reason for the gap.
- No tagging. Without UTM parameters, campaigns blend into "paid".
- No decision. A report should change something.
How do you build this report from your own data in TapCub?
TapCub does not run, bid on or optimise ads. It lets you set the ad platform's spend beside what happened after the click, using visitors counted separately from bots. For the example month:
- Tag every ad link with
utm_source,utm_mediumandutm_campaign. In Web analytics › Sources, open the UTM tab to see visitors, sessions, pageviews and bounce by source, medium, campaign, term and content. Ad click identifiers are recognised as paid search. - Open All-platform analytics › Business › Channel ROI and go to the Costs tab. Import spend with a CSV (columns
day,channel,source,campaign,cost,currency,clicks,impressions;dayandcostare required) or click Add one. Re-importing the same day, channel, source and campaign overwrites the row. - On the ROI tab, group by channel, source or campaign. TapCub shows cost per click (spend ÷ sessions), cost per acquisition (spend ÷ purchases) and return on ad spend (revenue ÷ spend). Revenue is the order amount and conversions are purchases on the order ledger, so purchases must be recorded with their amounts for the return to appear.
- In All-platform analytics › Behavior › Behavior analysis, use attribution models side by side (first, last, linear, position and time decay) to see which campaigns assist but never close.
- Margin, the break-even calculation and the recommendation stay in your own report; TapCub does not know your gross margin.
FAQ
What is a PPC report?
A PPC report summarises what a pay-per-click advertising programme spent and what it produced over a period: spend, clicks, orders, revenue and return, by campaign, with a recommendation. A good one runs from spend to sale and ends with decisions.
What should be included in a PPC report?
Spend, clicks, cost per click, sessions, conversion rate, cost per order, revenue, return on ad spend and contribution after ads, by campaign and in total, compared with the previous period. Add what changed, the decisions and an appendix for impressions and keywords.
How often should you send a PPC report?
Review the numbers weekly for movement, and send a report monthly for decisions. Weekly figures on small budgets fluctuate too much to act on, while a monthly report shows trend and lets a change take effect.
Why do ad platform numbers differ from analytics?
Clicks are not sessions, attribution windows and models differ, conversions may be defined differently, time zones and delays vary and consent changes who is tracked. State both figures and the usual ratio between them in the report.
What is a good ROAS?
It depends on margin. The break-even return is 1 ÷ gross margin, so 2.5 at a 40% margin. A return above that earns something after ad spend, one below loses money. Compare campaigns against break-even rather than a generic benchmark.
See also: PPC Dashboard: The Metrics, Formulas and Layout That Drive Decisions.
See also: Paid Search Optimization: A Six-Step Weekly Routine With Numbers.
Sources
- Google Ads Help. About Target ROAS bidding: target ROAS is the average conversion value you want for each dollar spent. Verified 2026-11-19.
- Analytics Help. Collect campaign data with custom URLs: utm_source, utm_medium, utm_campaign, utm_term, utm_content. Verified 2026-11-19.
Was this article helpful?
We use your answers to fix and expand this page.
Couldn’t send. Please try again in a minute.
Thanks for the feedback. We’ll use it to improve this page.You’ve already sent feedback on this page. Thanks.

Product Analyst
Focuses on event analysis, conversion funnels, and retention, using clear metric definitions and structured analysis to explain product performance.