Try it on your own data
Every report in this article is in the free plan. One snippet for web and apps, up to 10 sites.
Start freePrescriptive analytics recommends what to do: it takes predictions of outcomes, adds constraints such as a budget and an objective such as total orders, and returns a specific action. It sits after descriptive, diagnostic and predictive analytics and is only as good as its inputs. Below: a worked budget example, the tool kinds that fit and how plans fail.
What you will learn
- A prescription needs three things: predictions, constraints and one objective
- Re-run the plan when its inputs change; one wrong rate moved a $13,000 decision
- Choose the kind of tool by the shape of the decision, not by brand
What is prescriptive analytics?
Prescriptive analytics recommends what to do. It takes a prediction of what is likely to happen, adds the constraints you must respect (a budget, a capacity, a policy) and an objective you want to reach, and returns a specific action: spend this much here, schedule that many people there, send this offer to that group. INFORMS, the operations research society, describes analytics in three kinds: descriptive analytics looks at past events, predictive analytics looks at what is likely to happen, and prescriptive analytics recommends courses of action.
The key phrase is "specific action under constraints". A forecast that says orders will fall 8% next month is predictive. A plan that says move $5,000 from display to email, because that is the best use of a fixed budget given the forecast, is prescriptive. The plan is only as good as its two inputs: the predictions and the constraints. This guide shows where prescriptive analytics sits among the four types, works one allocation through by hand, and covers the kinds of tools that do this work. For the broader map of analytics types see types of data analytics; for the layer that comes just before prescription see diagnostic analytics.
The four types of analytics, side by side
Each type answers a different question and needs the one before it.
| Type | Question | Typical output | Example | Needs |
|---|---|---|---|---|
| Descriptive | What happened? | Totals, trends, dashboards | Orders by channel last month | Clean data |
| Diagnostic | Why did it happen? | A breakdown of causes | Orders fell because search traffic fell in two countries | Descriptive data, breakdowns |
| Predictive | What will probably happen? | A forecast or a score | Email will bring about 20 orders per $1,000 | History plus a model |
| Prescriptive | What should we do? | A recommended action | Spend $8,000 on email, $25,000 on search, $27,000 on social | Predictions, constraints, an objective |
Two consequences. First, you cannot skip levels: a recommendation built on a bad forecast is a precise-looking mistake, and a forecast built on unreliable descriptive data inherits the problem. Second, prescriptive analytics is a decision method, not a dashboard feature. For many decisions a clear diagnostic view and a person's judgement are enough; reserve optimisation for choices with many options and hard limits. See predictive analytics in marketing for the layer below.
How prescriptive analytics works: predict, constrain, optimise
Most prescriptive methods have the same three parts.
- A prediction of outcomes for each option. For each action you might take, how much of the thing you care about will it produce? In the example below: orders per $1,000 in each channel.
- Constraints. What you cannot do: total budget, the most a channel can absorb, minimum commitments, capacity.
- An objective. The one number to maximise or minimise, such as total orders or cost.
The method then searches for the combination of actions that gives the best value of the objective without breaking a constraint. When predictions are simple rates and the constraints are straight limits, this is a linear program: a linear objective subject to linear equality and inequality constraints, which SciPy's linprog documentation uses as the definition of the problem it solves. Other cases need simulation or rules instead of optimisation. The mathematics matters less than checking that each of the three parts is stated honestly.
Worked example: allocating a $60,000 budget across four channels
Sample data: a shop has $60,000 to spend this month. A back-test of past campaigns gives an estimate of orders per $1,000 in each channel, and each channel can only absorb so much before the estimate stops being true:
| Channel | Predicted orders per $1,000 | Most it can absorb |
|---|---|---|
| 20 | $8,000 | |
| Search | 14 | $25,000 |
| Social | 9 | $40,000 |
| Display | 6 | $30,000 |
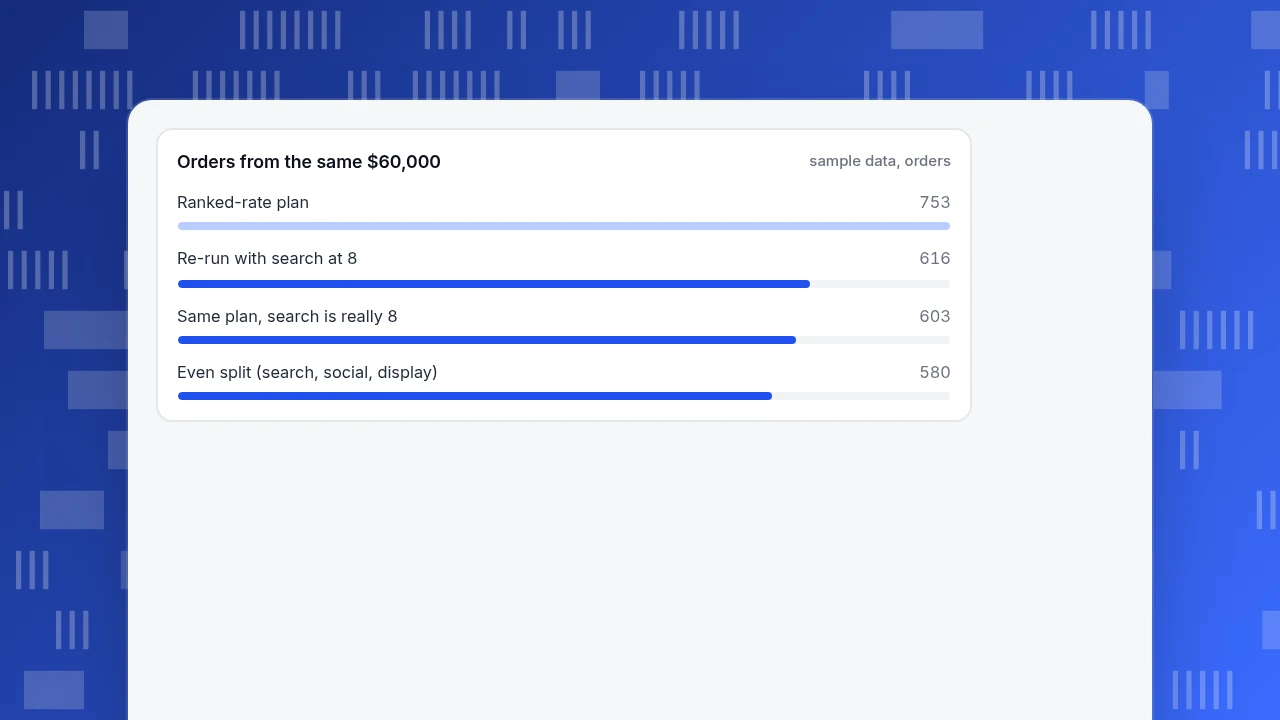
The habit. Last year the budget was split evenly across search, social and display, $20,000 each, and email was ignored. Orders: 20 × 14 + 20 × 9 + 20 × 6 = 280 + 180 + 120 = 580, at $60,000 ÷ 580 = $103.45 per order.
The prescription. The objective is total orders, the constraints are the $60,000 total and each channel's limit. With constant rates this is solved by spending on the best rate first until a limit is reached:
- Email, 20 per $1,000: spend its $8,000 limit, 8 × 20 = 160 orders.
- Search, 14: spend its $25,000 limit, 25 × 14 = 350 orders.
- Social, 9: the remaining $60,000 − $8,000 − $25,000 = $27,000, 27 × 9 = 243 orders.
- Display, 6: nothing is left.
Total: 160 + 350 + 243 = 753 orders, at $60,000 ÷ 753 = $79.68 per order, which is 753 ÷ 580 − 1 = 29.8% more orders than the even split from the same money.
When the prediction is wrong. Suppose search really delivers 8 orders per $1,000, not 14. The plan above then yields 160 + 25 × 8 + 243 = 160 + 200 + 243 = 603 orders. Re-running with the corrected rate puts $40,000 into social and only $12,000 into search, giving 160 + 360 + 96 = 616. The recommendation changed (search drops from $25,000 to $12,000) and the unadjusted plan lost 13 orders, 2.1%. The method is sound; the input was off. In practice a prescriptive plan is re-run whenever the inputs are updated, not followed for a quarter.
Three things generalise from this example. The ranking was driven by the rates, so spend your effort on the rates: a 10% error in the search estimate is 1.4 orders per $1,000, enough to matter near a tie. The limits did real work: without the email limit the plan would put all $60,000 into email at 20 per $1,000 and predict 1,200 orders, which an 8,000-person list could never deliver. And the answer is the start of a test, not a decision: run the new split for a month, compare actual orders with 753 and update the rates.
Orders from the same $60,000
sample data, ordersPrescriptive analytics tools: what kind do you need?
Tools fall into groups by the job they do. Choose by the shape of your decision, not by brand.
| Kind of tool | Fits when | Limit |
|---|---|---|
| Spreadsheet solver | Small allocation or scheduling problems, a few dozen variables | Hard to audit and share; weak with big problems |
| Optimisation solver or library | Allocation, routing, scheduling with clear constraints | Needs someone who can model the problem in code |
| Simulation | Systems with randomness or queues (staffing, inventory) | Shows outcomes of options; you still pick the option |
| Rules or decision engine | Policies you can state as if-then (offers, approvals) | Does not discover better rules by itself |
| Dashboard with what-if inputs | Quick comparison of a few options | Not an optimiser; the person finds the best case |
Before buying anything, answer three questions. Can you state the objective as one number? Can you list the constraints? Do you have predictions you trust, since the best optimiser cannot rescue a poor forecast? If any answer is no, fix that first; a prescriptive tool on weak inputs produces confident, wrong plans.
When prescriptive analytics goes wrong
- The predictions are weak. In the example, one wrong rate moved a $13,000 decision.
- A constraint is missing. If email is a list of 8,000 people who will unsubscribe if mailed daily, the $8,000 limit is the only thing stopping a bad plan.
- The objective ignores something that matters. Maximising orders can favour discount-heavy channels; add a margin or a quality floor.
- The rates are not constant. Spending rarely buys the same return at every level; rates fall as you spend, so keep limits realistic.
- Nobody owns the recommendation. A plan that no one will act on, or cannot reverse, is a report.
| Failure | What it looks like | Guard against it |
|---|---|---|
| Weak predictions | One wrong rate flips the allocation | Back-test rates and re-run when they change |
| Missing constraint | The plan overspends a channel that cannot absorb it | List limits before solving |
| Narrow objective | Orders rise but margin falls | Add a margin or quality floor |
| Constant-rate assumption | Returns fall as spend rises | Keep limits realistic |
Write the predictions and constraints next to the plan so others can challenge them.
Common mistakes with prescriptive analytics
- Starting with the tool. Start with the decision, its objective and its constraints.
- Skipping diagnosis. If you do not know why a channel's rate changed, you cannot trust the next prediction.
- Treating one run as the answer. Re-run when rates, prices or limits change.
- Hiding the assumptions. Write the predictions and constraints next to the plan so others can challenge them.
- Automating before validating. Run the plan in a small test, compare actual with predicted and then widen it.
In TapCub: the evidence for the inputs, not the optimiser
Take the budget example. TapCub supplies some of the evidence for the prediction step and none of the solving.
- Measure each channel's cost and yield. In All-platform analytics › Business › Channel ROI, import daily spend by channel, source or campaign (CSV or one by one). The page shows cost per click (spend ÷ sessions), cost per acquisition (spend ÷ purchases in orders) and return on ad spend. These are the raw material for your orders-per-$1,000 estimates, but they describe the past only.
- Compare channel credit. In All-platform analytics › Behavior › Behavior analysis, select several attribution models side by side (first, last, linear, position, time decay). A channel that only assists shows up as a gap between models, which warns you against a rate based on last-touch alone.
- Find out why a rate changed. In All-platform analytics › Operations › AI Assistant, ask why a number changed; the change attribution splits the movement across channel, source domain, country, device and landing page. That is the diagnostic step before you update a prediction.
- Watch the result. In All-platform analytics › Operations › Monitors, set a monitor on a metric such as orders or error rate; it notifies you and does nothing else.
TapCub does not forecast, solve an optimisation or move budgets, and its assistant will not create monitors or send notifications on your behalf. The prediction, the constraints and the solving happen in your own model; TapCub shows you whether the plan worked afterwards.
FAQ
What is prescriptive analytics?
Prescriptive analytics recommends a specific action. It combines a prediction of outcomes, constraints such as a budget or capacity, and an objective such as maximising orders, then finds the combination of actions that serves the objective. INFORMS describes it as recommending courses of action, after descriptive and predictive analytics.
What is the difference between predictive and prescriptive analytics?
Predictive analytics tells you what is likely to happen, for example a forecast of orders. Prescriptive analytics uses such predictions to recommend what to do, for example how to split a budget. A prediction does not choose between options; a prescription does, within limits you set.
What are prescriptive analytics tools?
They are tools for finding the best action under constraints: spreadsheet solvers, optimisation solvers and libraries, simulation software, rules or decision engines, and dashboards with what-if inputs. Pick by the shape of your decision. Without a clear objective, constraints and trustworthy predictions, none of them will give a reliable plan.
Is prescriptive analytics worth it for a small team?
Often a spreadsheet and a clear question are enough. In the example, a simple rate-ranking beat an even split by 29.8%. The harder part is trustworthy predictions and honest constraints, so start with one decision, such as a monthly budget split, and re-run it as data changes.
Sources
- INFORMS. What is Analytics? — descriptive, predictive and prescriptive analytics, the last recommending courses of action. Checked 2026-11-19.
- SciPy. scipy.optimize.linprog — the linear programming problem: a linear objective subject to linear equality and inequality constraints. Checked 2026-11-19.
Was this article helpful?
We use your answers to fix and expand this page.
Couldn’t send. Please try again in a minute.
Thanks for the feedback. We’ll use it to improve this page.You’ve already sent feedback on this page. Thanks.

Customer Experience Consultant
Writes about live chat, visitor conversations, and self-service, sharing practical ways to make customer communication clearer and more effective.