Try it on your own data
Every report in this article is in the free plan. One snippet for web and apps, up to 10 sites.
Start freeA product analytics platform records what people do in your product as events tied to a person, then lets you analyse funnels, retention and paths. To choose one, check two foundations first: the event model, which decides what you can ask, and identity, which decides whether answers are about people or devices. Below: a trial checklist and a scoring example.
What you will learn
- Check the event model and identity before any other feature
- Test identity by logging in on a second device and counting people
- Write the scoring weights down before the trial, because the weights decide the winner
What is a product analytics platform?
A product analytics platform records what people do inside your product as events tied to a person, and lets you analyse those events as funnels, retention, paths and groups of users. It answers questions a pageview report cannot: which step of onboarding loses people, whether people who use a feature come back, what users did before they left. The term covers anything from a single analysis tool to a suite that also bundles replays, experiments and flags.
Choosing one is mostly a matter of checking two foundations and a handful of capabilities. The foundations are the event model, which decides what you can ask, and identity, which decides whether the answers are about people or about devices. Everything else, from dashboards to AI, sits on top of those two. For what product analytics is as a discipline see product analytics, and for how to decide which metrics to track see product analytics framework. This guide is the buyer's side: what to check, in what order, and how to score what you find.
The event model: the first thing to check
An event is a record that something happened. In Mixpanel's documentation, each event has a name, a timestamp and a distinct ID that ties it to a user, and can carry properties such as a page URL or a sign-up type. That structure is common across platforms, so the useful question is how much work it takes to get from "something happened" to "an answer".
Check these four things in a trial:
- Can you define a step with a property? "Created a project" is an event; "created a project from a template, on mobile" needs properties on it. If property filters are weak, your funnels stay vague.
- Is there a place to plan events? Without a shared list of event names, properties and owners, the data drifts into three names for the same thing. Look for a tracking plan or an event dictionary, and for a way to see which events actually arrive.
- Can you add events later? Some tools record every interaction automatically and let you name events afterwards; others only count what you send. Automatic capture saves set-up time but needs governance; sent events need developer time but are cleaner. Decide which cost you would rather pay.
- Can you reach the raw events? A SQL query, a raw export or a warehouse sync is your escape hatch when a question does not fit the built-in reports.
A platform that is easy to start and impossible to govern is a trap at scale. Ask what the tenth analyst will see when they open the event list.
Identity: people, not devices
Identity decides whether "users" means people. Mixpanel's identity documentation describes the usual design: the SDK generates an anonymous device ID, events before login belong to it, and when your code identifies the user the platform links the device ID to the user ID so they count as one person. Without that linking, a visitor who browses anonymously and then signs up appears as two people.
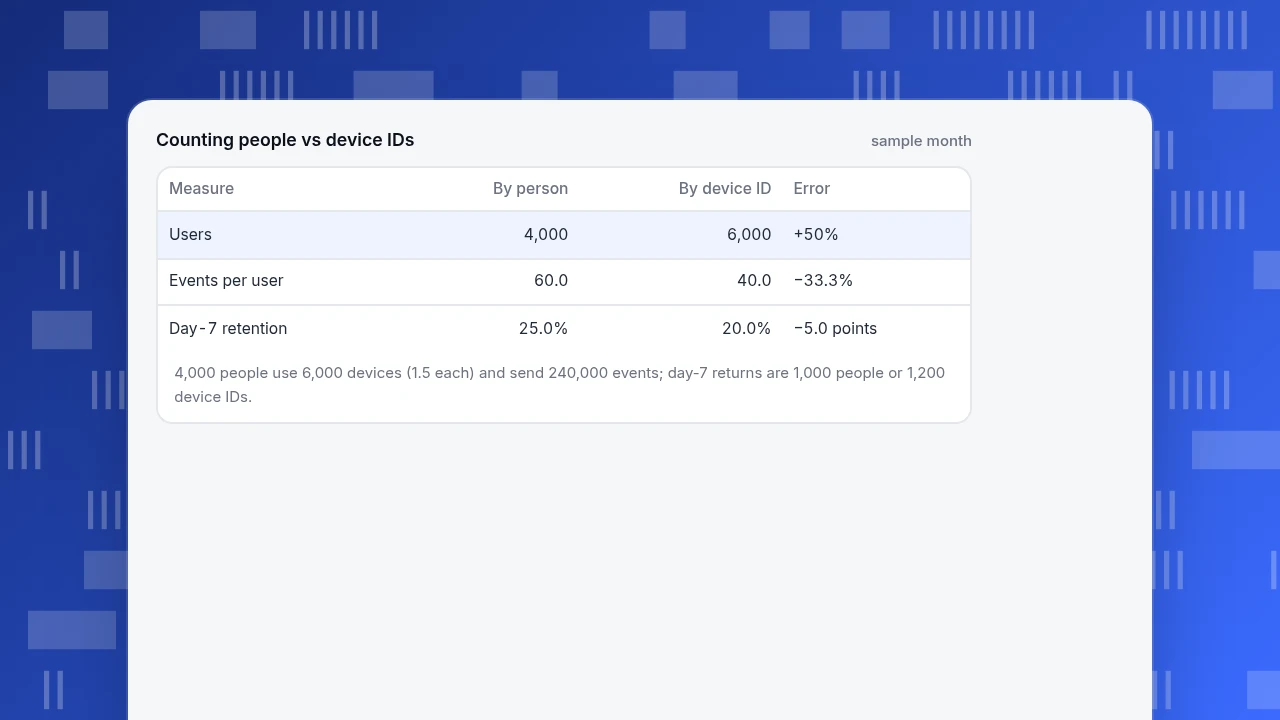
The size of the error is easy to compute. Sample data: 4,000 people log in during the month, and between them they use 6,000 devices or browsers (1.5 per person on average), each with its own anonymous ID. They send 240,000 events.
| Measure | Counted by person | Counted by device ID | Error |
|---|---|---|---|
| Users | 4,000 | 6,000 | Overstated by 6,000 ÷ 4,000 − 1 = 50% |
| Events per user | 240,000 ÷ 4,000 = 60.0 | 240,000 ÷ 6,000 = 40.0 | Understated by 1 − 40 ÷ 60 = 33.3% |
| Day-7 retention | 1,000 ÷ 4,000 = 25.0% | 1,200 ÷ 6,000 = 20.0% | A person who returns on a second device counts as lost |
Questions to ask about identity:
- Is there a merge, and what triggers it? Typically a login or sign-up call. Check what happens when two people share a device and when one person logs in on a new phone.
- Are there people who cannot be identified? Anonymous visitors usually have no profile. That is fine, but check how they appear in reports.
- Is there a level above the person? B2B products need accounts (a company, a workspace). Check whether analyses can group by account.
Counting people vs device IDs
sample month| Measure | By person | By device ID | Error |
|---|---|---|---|
| Users | 4,000 | 6,000 | +50% |
| Events per user | 60.0 | 40.0 | −33.3% |
| Day-7 retention | 25.0% | 20.0% | −5.0 points |
4,000 people use 6,000 devices (1.5 each) and send 240,000 events; day-7 returns are 1,000 people or 1,200 device IDs.
A checklist for choosing, with what to ask in a trial
Use the table as a script for a trial week. Each row has a question you can answer by doing something, not by reading a feature page.
| Capability | Question to run in a trial | Red flag |
|---|---|---|
| Event model | Build a funnel with a property filter on step two | Needs a developer or an export to do it |
| Identity | Log in on a second device and check the person count | Counted twice |
| Analysis depth | Build funnel, retention and a path from the same events | Each needs separate set-up |
| Segments | Save a group of users and reuse it in two analyses | Rebuilt by hand each time |
| Data governance | Find the list of planned events and see which arrived | No list, or no way to check arrival |
| Data access | Run a query or export raw events | Only chart screenshots |
| Privacy | Find the consent and retention settings | Not configurable or not documented |
| Cost model | Estimate the monthly bill at 2× your current volume | You cannot predict it |
For the cost row, estimate event volume as monthly active users × events per user. With the sample above, 4,000 × 60 = 240,000 events a month; if the product doubles in users and adds richer tracking, 8,000 × 90 = 720,000. Pricing is often tied to events or users, so a model you cannot forecast is a risk.
Worked example: scoring two platforms with weights
Sample data: a team scores two unnamed platforms from 1 to 5 on six criteria and weights each criterion by importance. Weighted score = Σ(weight × score) ÷ 100.
| Criterion | Weight | Platform A | Platform B |
|---|---|---|---|
| Event model | 25 | 4 | 3 |
| Identity | 25 | 3 | 5 |
| Analysis depth | 20 | 5 | 4 |
| Data governance | 15 | 2 | 4 |
| Data access | 10 | 4 | 3 |
| Privacy and cost | 5 | 3 | 4 |
| Weighted score | 100 | 3.60 | 3.90 |
Platform A: (25 × 4 + 25 × 3 + 20 × 5 + 15 × 2 + 10 × 4 + 5 × 3) ÷ 100 = 360 ÷ 100 = 3.60. Platform B: (75 + 125 + 80 + 60 + 30 + 20) ÷ 100 = 3.90.
The weights decided it. If the team had weighted analysis depth at 30 and identity at 15, Platform A would score (100 + 45 + 150 + 30 + 40 + 15) ÷ 100 = 3.80 and Platform B (75 + 75 + 120 + 60 + 30 + 20) ÷ 100 = 3.80, a tie. So write the weights down before the trial, ask who disagrees, and run the trial on the criteria with the highest weights first. A score is a way of making a disagreement visible, not of ending it.
How to run a two-week trial
- Pick five questions you actually have, such as "where do new users stall?" and "do people who use feature X come back?". If the platform cannot answer them, no feature list will help.
- Instrument one real flow, not a demo. Send the events for onboarding, with properties, and identify users at login.
- Answer the five questions with the data and time how long each took. Note which needed help.
- Check the numbers against a source you trust, such as orders in your database. Small gaps are normal; large unexplained ones are a finding.
- Ask someone else on the team to repeat one analysis without your help. If they cannot, adoption will stall.
| Check | What it decides | What goes wrong if it fails |
|---|---|---|
| Event model | What questions you can ask | Funnels stay vague without property filters |
| Identity | Whether users are people or devices | Duplicate people and wrong retention, with no error shown |
| Governance | Whether event names stay consistent | Three names for one event |
| Data access | Whether you can leave the built-in reports | Stuck when a question does not fit |
| Cost model | Whether the bill is predictable | A surprise when volume doubles |
Run each check in a trial on your own events, not on a demo dataset.
Common mistakes when choosing a product analytics platform
- Choosing by feature count. A long list hides whether the core (events and identity) works.
- Skipping the identity test. Duplicate people are silent: no error, just wrong numbers.
- Instrumenting everything at once. Start with one flow and a tracking plan.
- Ignoring who will run it. A tool only analysts can use will not change product decisions.
- Treating the demo dataset as evidence. Trial on your own events.
- Forgetting cost growth. Estimate the bill at twice your volume before you commit.
In TapCub: one project for web, app and mini-program events
Take the checklist above. This is how TapCub answers its rows, and what it does not cover.
- Events. Send custom events from the web script or an iOS, Android, Flutter, React Native or Harmony SDK, or from the server over HTTP. The script also collects outbound clicks and file downloads by default. New events appear first in All-platform analytics › Data › Event inbox and join the formal definitions once claimed.
- Planning and checks. Record planned events in All-platform analytics › Data › Tracking plan with owner and status, then turn on live validation (last 24 hours) to see arrivals and how complete the required properties are. Property dictionary keeps property meanings in one place.
- Identity. Call
tapcub.loginwhen users sign in so their earlier anonymous activity merges onto one person in All-platform analytics › Users › People, with a day-by-day timeline. Anonymous visitors have no profile. For B2B,tapcub.group('company', ...)gives an accounts view with a 0–100 health score. - Analysis. All-platform analytics › Behavior › Behavior analysis holds funnels, retention, paths, distribution, lifecycle and attribution; segments in Segments & tags can be carried into them. Metrics & SQL defines your own metrics and runs SQL on event data.
- Access and privacy. Data › Data export makes asynchronous raw exports. Configuration › Privacy center holds the collection levels, retention and data-subject requests.
TapCub does not run A/B tests, feature flags or surveys; it measures what happens after you ship. See analytics for product managers for how product teams use these reports.
FAQ
What is a product analytics platform?
A product analytics platform records what people do in your product as events tied to a person, and lets you analyse them as funnels, retention, paths and user groups. It answers questions about behaviour inside the product, such as where onboarding loses people or whether a feature brings users back.
What features should a product analytics platform have?
An event model with properties, reliable identity that links anonymous activity to a person after login, funnel, retention and path analysis, reusable segments, a way to govern event names, and raw data access through SQL or export. Privacy settings and a predictable cost model matter too.
How do you choose a product analytics platform?
Score candidates on weighted criteria, then run a two-week trial on one real flow. Test identity by logging in on a second device, build a funnel with a property filter, and ask a teammate to repeat an analysis. In the sample, the weights alone moved the winner, so agree on them first.
How is product analytics different from web analytics?
Web analytics centres on pages, sessions and traffic sources. Product analytics centres on events and people inside a product, so it can follow one person across sessions and devices. The two overlap; TapCub keeps web, app and mini-program data in one project with one event and user model.
See also: Data Analytics Platform: Layers, Shapes and How to Choose One.
See also: Product Analytics: What It Is, Key Metrics and How to Start.
Sources
- Mixpanel. Events and properties — an event has a name, a timestamp and a distinct ID, and can carry properties. Checked 2026-11-19.
- Mixpanel. Identifying users with simplified ID merge — anonymous device IDs linked to user IDs after login so one person counts once. Checked 2026-11-19.
Was this article helpful?
We use your answers to fix and expand this page.
Couldn’t send. Please try again in a minute.
Thanks for the feedback. We’ll use it to improve this page.You’ve already sent feedback on this page. Thanks.

Product Experience Specialist
Writes about product experience, practical workflows, and growth, turning complex processes into clear steps for everyday decisions.