Try it on your own data
Every report in this article is in the free plan. One snippet for web and apps, up to 10 sites.
Start freeProduct analytics measures how people use a digital product through the events they trigger. This guide covers what it is, how it differs from web analytics, the questions it answers, six core metrics with formulas, the data model, a sample-data example and how to start without a data team.
What you will learn
- Product analytics turns events into answers about activation, retention and feature use; web analytics covers traffic and sources.
- Six metrics cover most decisions: activation rate, time to value, retention, DAU/MAU stickiness, funnel conversion and feature adoption. Define active first.
- Start from three outcomes and about ten events, or capture automatically and name the interactions that matter; review weekly.
What is product analytics?
Product analytics is the practice of measuring how people use a digital product, based on the events they trigger, so you can decide what to fix, build or stop building. Instead of asking "how many people visited?", it asks "what did they do, did they reach the point where the product is useful, and did they come back?"
Mixpanel's 2026 guide describes it as a discipline "focused on understanding how users interact with a digital product", built on tracking discrete user actions. Amplitude defines it as "the process used to understand how customers engage with digital products" (Amplitude guide). Both fit one working definition: events in, answers about activation, retention and feature use out. This guide gives the definition, the questions and metrics (with formulas), the data model, a sample-data example you can recompute, and a practical way to start without a data team.
How is product analytics different from web analytics?
Web analytics measures traffic: visitors, sources and pages viewed, mostly for marketing. Product analytics measures behaviour inside the product: who finished onboarding, which features they use and whether they return. Mixpanel's own example makes the split concrete: web analytics shows pricing-page visits, while product analytics shows how users who completed a tutorial convert.
Pendo's glossary adds a practical point: tools built mainly for web analytics typically need events tagged in advance and offer limited segmentation by account or role, so behaviour is harder to examine after the fact. That is a vendor view, but it matches what teams run into.
In practice the two overlap. A sign-up funnel starts on a marketing page and ends inside the app. Our product vs marketing analytics guide covers the boundary in depth, and the product analytics comparison shows how the tool categories stack up. The short version: use web analytics to learn where visitors come from, and product analytics to learn what they do after they arrive.
What questions does product analytics answer?
Most useful questions fall into four groups.
- Activation. Do new users reach the first moment of value? Which early action separates people who stay from people who leave?
- Retention. Do users come back after day 1, week 1, week 4? Does the curve flatten, or keep falling to zero?
- Feature use. Which features are used, by whom, and how often? Which ones nobody touches?
- Paths and friction. What do people do before and after a key action? Where do they stall in a multi-step flow such as sign-up or checkout?
Amplitude's guide lists the same family of questions: who the most valuable customers are, who churns and what they did beforehand, and where users get stuck. Pendo adds trends, funnels and paths as the three core analysis types. Notice that none of these is "how many pageviews". Amplitude calls pageviews and clicks "vanity metrics" when read alone; whether or not you agree with the label, the point stands that a raw count rarely tells you what to do next.
Which product analytics metrics matter?
You do not need dozens. Six cover most decisions. The table below defines each with a formula; the sample-data section shows two of them being computed.
Two cautions. First, define "active" before you compute anything: a login, a key action, or any event. Mixpanel suggests starting from a North Star metric and breaking it into the behaviours that drive it. Second, read retention as a curve. Mixpanel notes that a curve which flattens above zero suggests some users have found lasting value; a curve that keeps falling to zero says nobody has.
A note on time to value: it is the elapsed time between sign-up and the first key action. If it is long, onboarding is the problem, not acquisition. Mixpanel makes the related point that fixing activation before scaling acquisition avoids sending more users into the same drop-off.
| Metric | Formula | What it tells you |
|---|---|---|
| Activation rate | users who reach the key action / new users | Whether onboarding delivers first value |
| Time to value | time of first key action - time of sign-up | How long new users wait for value |
| Retention (week N) | users active in week N / users in the cohort | Whether value lasts; read as a curve |
| Stickiness | DAU / MAU | How many days a month active users show up |
| Funnel conversion | users completing a step / users entering the funnel | Where a multi-step flow loses people |
| Feature adoption | users of a feature / active users | Which features earn their place |
Define what counts as active before computing any rate.
What is the product analytics data model: events, properties and identities?
Every product analytics tool rests on three ideas.
- Events are things that happen:
signed_up,project_created,invite_sent. Each records what happened, when, and who did it, which is how Mixpanel describes an event. - Properties describe an event or a person: the plan on a
checkout_startedevent, the country on a profile, the referral source on a sign-up. They are what lets you slice a funnel by plan or a retention curve by channel. - Identities tie events to people. A visitor is anonymous until login. After login, one person may have a phone and a laptop, and good tooling merges those devices into one profile so you do not count the same person twice.
Two design choices follow. Name events as a verb phrase in a consistent pattern and keep the list short; every near-duplicate (signup, sign_up, Signed Up) splits your data. And decide what counts as "active" at the event level, because retention and stickiness depend on it. Google's analytics documentation takes the same event-first view: many of Google Analytics' dimensions and metrics come from event parameters, which is why consistent event naming matters even in a web-analytics tool.
What does a sample product analytics calculation look like?
This is sample data for a made-up SaaS product, not a real site. Over one month, 2,000 people visited the sign-up page and 200 created an account. "Activated" means the account created its first project within 7 days. "Week-4 retained" means the account was active in the fourth week after sign-up.
| Group | Accounts | Week-4 retained | Rate |
|---|---|---|---|
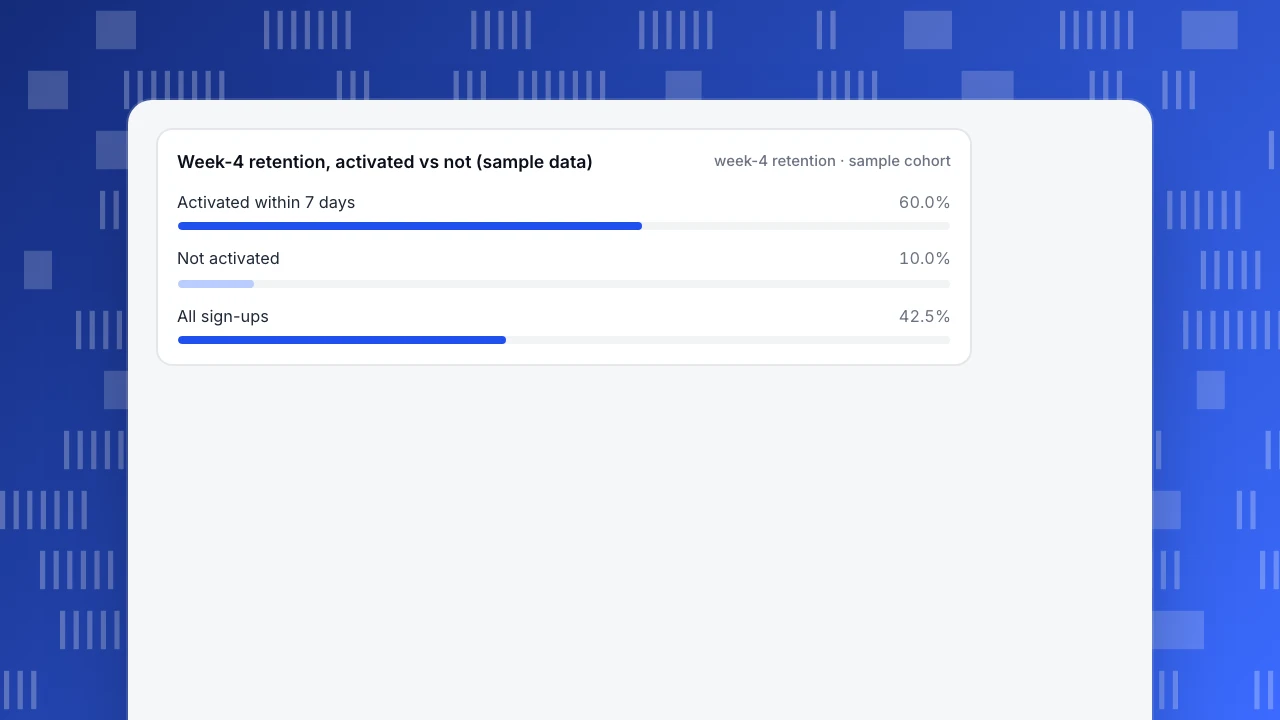
| Activated within 7 days | 130 | 78 | 60.0% |
| Not activated | 70 | 7 | 10.0% |
| All sign-ups | 200 | 85 | 42.5% |
Recompute it. Sign-up rate: 200 / 2,000 = 10.0%. Activation rate: 130 / 200 = 65.0%. Week-4 retention for activated accounts: 78 / 130 = 60.0%; for the rest: 7 / 70 = 10.0%; overall: (78 + 7) / 200 = 85 / 200 = 42.5%.
Stickiness works the same way. Suppose the product averages 1,800 daily active users and has 6,000 monthly active users. DAU / MAU = 1,800 / 6,000 = 30.0%, meaning the average monthly user is active on roughly nine days of a 30-day month.
What the numbers say: activated accounts retain six times better (60.0% against 10.0%), so the 70 accounts that never create a project are the biggest lever. Raising activation from 65.0% to 75.0% would put 150 of 200 accounts on the stronger path. If the same 60.0% and 10.0% rates held, week-4 retention would rise to (150 x 0.60 + 50 x 0.10) / 200 = 47.5%. That is an illustration of why activation comes first, not a promise about any real product, and it assumes the rates stay the same, which they might not.
Week-4 retention, activated vs not (sample data)
week-4 retention · sample cohortHow do you start product analytics without a data team?
Start from outcomes, not from tools. Amplitude's guide advises that instrumentation "should begin with answering the most pressing business question", and Mixpanel advises starting from a North Star metric and its leading indicators.
- Write down three outcomes. For example: sign-ups that create a first project, users who return in week 2, customers who upgrade.
- Choose about ten events that mark those outcomes. A first tracking plan can be a one-page list: event name, trigger, one or two properties, owner. For a SaaS product that might be
signed_up,project_created,teammate_invited,feature_used,upgrade_clickedandplan_changed. - Decide what "active" means and which events count.
- Build three views first: a funnel from landing to activation, a retention curve for new sign-ups, and a list of the top events by unique users.
- Review weekly. Pick one drop-off, change one thing, and compare the next cohort.
If you cannot write the plan up front, there is a second route: capture interactions automatically, then name the ones that matter. Autocapture records clicks without code, and the work moves from writing instrumentation to deciding which captured interactions are real events. The risk is noise, so you still need a short list of outcomes and a person who owns the names. Our product analytics framework guide walks through the planning route, and product analytics examples shows what teams measure in practice.
What mistakes should you avoid?
- Tracking everything and answering nothing. A large event list without a question behind it produces dashboards nobody reads.
- Inconsistent names.
signup,sign_upandSigned Upbecome three events. Pick one pattern and review new names before they ship. - Vanity metrics. Total sign-ups and pageviews rise while retention falls. Pair every volume metric with a rate.
- An unclear definition of "active". If a background job or a server-side charge counts as activity, retention looks better than it is.
- Reading averages across cohorts. Compare cohorts by sign-up week and by channel.
- Funnel errors. Wrong step order, windows that are too short, and mixed counting rules distort conversion; see funnel analysis mistakes.
- Treating the numbers as the answer. Analytics shows what happened. For why, talk to users or look at the session.
How does TapCub handle product analytics?
TapCub puts product analytics next to website analytics and live chat, on one script and one dataset. The product page is at /insights; here is what the documentation says it does.
Autocapture plus AI-suggested names. With autocapture on (and a plan that includes it), the script records clickable elements, never password fields. An event inbox clusters them by element and page and suggests a name from rules or from a model. Nothing becomes an official event until you accept it, and accepting backfills the last 90 days of autocapture, so you can analyse behaviour that happened before you named it. You can also send custom events from code and keep an optional tracking plan.
Funnels, retention, paths and segments on the same data. Funnels take 2 to 20 steps with a window of up to 180 days. Retention supports day, week and month cohorts, and lifecycle and stickiness views sit alongside it. Paths show what comes next, and segments save groups of people for reuse. They all read the same events, so you do not export between tools.
User profiles and identity. With identified mode on, calling tapcub.login() creates a person, and the timeline merges the devices tied to one login id. Identified mode is available on Pro and above, not on the Free plan; anonymous projects count visitors but do not build profiles.
Live chat on the same data. When a visitor opens a chat, your team sees their country, source, current page and path. The same people can be found in analytics.
What it does not do. TapCub does not run A/B tests, feature flags or surveys. Pair it with a dedicated tool if you need those. If your team is a large enterprise needing warehouse-native modelling, a heavier platform may suit better; the product analytics tools and platform guides compare the options, and a dashboard guide covers what to put on screen first.
FAQ
What is product analytics?
Product analytics measures how people use a digital product through the events they trigger, to answer questions about activation, retention, feature use and conversion. It is usually used by product, growth and engineering teams. For the short definition see the product analytics glossary entry.
What are the main product analytics metrics?
Activation rate, retention (day, week or month), DAU / MAU stickiness, funnel conversion, feature adoption and time to value. Define "active" first, then compute each as a rate so you can compare cohorts.
How is product analytics different from Google Analytics?
Google Analytics is built around website traffic and marketing, and is event-based too. Product analytics tools centre on people and accounts inside a product: cohorts, retention curves, feature adoption and identity merging. Pendo describes Google Analytics as designed more for web analytics, SEO and marketing. Many teams use both.
Do I need a data team for product analytics?
No. A product manager or founder can start with about ten events, three views (funnel, retention, top events) and a weekly review. A data team becomes useful when you need custom modelling, warehouse joins or a governance process.
How many events should I track?
Start with about ten that map to your outcomes. Add more only when a specific question needs them. With autocapture you collect broadly but should still promote only the interactions that answer questions.
How much does product analytics software cost?
It varies by vendor, event volume and features, and tiers change, so check each vendor's pricing page. TapCub has a Free plan, with identified mode and some other features on paid plans.
See also: Funnel Analysis: How to Build, Read and Fix a Funnel; User Activation Rate: How to Define, Measure and Improve It
Sources
- Mixpanel (2026). What is product analytics? A complete guide for 2026 — product analytics tracks discrete user actions (events); web analytics measures traffic; DAU / WAU / MAU, stickiness (DAU/MAU), N-day retention; start from a North Star metric. Last edited May 18, 2026; read 2026-11-21.
- Amplitude. The Amplitude Guide to Product Analytics — "the process used to understand how customers engage with digital products"; instrumentation "should begin with answering the most pressing business question". Read 2026-11-21.
- Pendo. Product analytics glossary — event tracking, event properties and grouping; trends, funnels and paths; Google Analytics described as designed more for web analytics, SEO and marketing. Vendor view; read 2026-11-21.
- Google. GA4 dimensions and metrics reference — many dimensions and metrics come from event parameters. Read 2026-11-21.
- TapCub product documentation (apps/docs, events, event inbox, funnels, retention, people), checked 2026-11-21.
Was this article helpful?
We use your answers to fix and expand this page.
Couldn’t send. Please try again in a minute.
Thanks for the feedback. We’ll use it to improve this page.You’ve already sent feedback on this page. Thanks.

Data Engineer
Writes about event design, data quality, and collection workflows, with verifiable implementation methods for reliable analytics.