Try it on your own data
Every report in this article is in the free plan. One snippet for web and apps, up to 10 sites.
Start freeProduct benchmarking compares your product's measurements with a reference point; for usage metrics the reliable one is your own history. Build a P25 to P75 band from your last 12 weeks, judge new values against it, and use an outside benchmark only when its definition, unit and period match yours.
What you will learn
- An outside benchmark is usable only when definition, unit, period and method match; until then your own history is the better benchmark
- In the sample, week-12 activation of 44.6% is above the P25 to P75 band of 39.55 to 41.80, but first rule out tracking changes and mix shifts
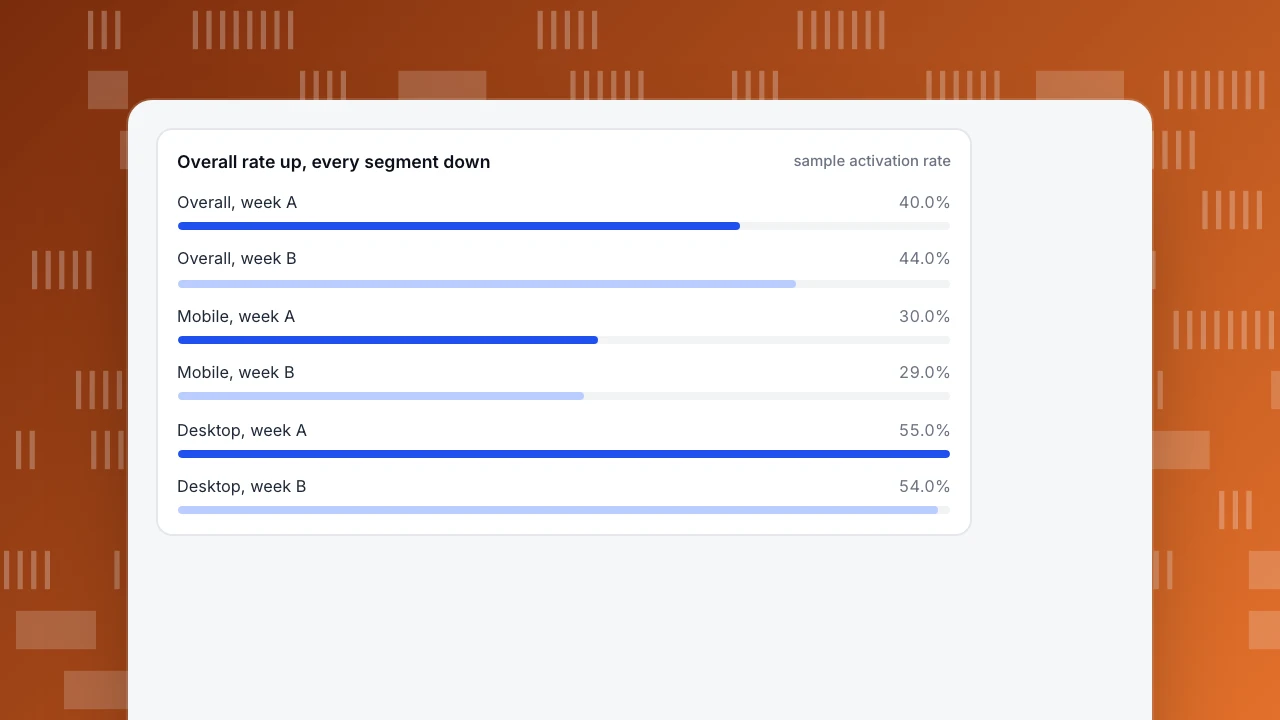
- A mix shift can raise the overall rate by four points while every segment falls: 40.0% to 44.0% with both segments a point worse
What is product benchmarking, and which kind do you need?
Product benchmarking is comparing your product's measurements against a reference point to see whether a number is good, bad or ordinary. Most guides treat it as a feature comparison with rivals, which the competitor benchmarking guide covers. This guide is about the other kind: benchmarking how people use your product, such as activation, retention and feature adoption, because that is where the reference points are easiest to get wrong. The general idea is defined on the benchmarking page.
There are three kinds of reference point, with very different reliability:
| Reference | Compares you with | Reliability | Main risk |
|---|---|---|---|
| Internal | Your own past weeks and your own segments | High: same definition, same product | Says nothing about how you compare with the market |
| Published | A public dataset with a stated method | Medium: definitions are visible | The unit or population differs from yours |
| Peer exchange | Numbers other companies share privately | Low unless definitions are written | Self-selected, unaudited, definitions unknown |
The claim to hold on to is that an outside benchmark is only usable once its definition, unit and period match yours; until then your own history is the better benchmark. The rest of the guide shows how to build the internal one properly, then how to test an outside number before you rely on it.
Which usage metrics are worth benchmarking?
Pick metrics that describe whether people get value, with a written definition each, so that you can compare like with like later.
| Metric | Definition | Better when | Watch out for |
|---|---|---|---|
| Activation rate | New users who do the key first action within 7 days ÷ new users | Higher | Counting a page view as activation |
| Week-1 retention | New users active again in days 1 to 7 ÷ new users | Higher | Mixing new and returning users |
| Feature adoption | Active users who used the feature in the period ÷ active users | Higher, if the feature matters | Adoption that does not change retention |
| Task completion time | Median time to finish an ordered task | Lower | Using the mean, which outliers distort |
| Error rate | Errors ÷ page views | Lower | Counting bots as users |
| Support contacts | Conversations ÷ active users | Lower | Fewer contacts because help is hard to find |
Keep to four to six. A benchmark table of twenty metrics is read once and never again. Compute every rate on real people only, since crawlers and bots in the denominator drag every rate down.
How do you benchmark against your own history?
Take the last 12 weeks of a metric, sort them and read the quartiles. The 25th percentile (P25) is the value below which a quarter of the weeks fall, the 50th is the median and the 75th (P75) is the value below which three quarters fall. The band between P25 and P75 is what a normal week looks like for you.
Compute the band from the weeks before the one you are judging, so that the new value does not move its own yardstick.
Sample data: weekly values for three metrics over 12 weeks. The band uses weeks 1 to 11 and the judged value is week 12.
| Metric | P25 | Median | P75 | Week 12 | Position |
|---|---|---|---|---|---|
| Activation rate (%) | 39.55 | 40.90 | 41.80 | 44.60 | Above the band |
| Week-1 retention (%) | 22.05 | 22.50 | 22.95 | 22.10 | Inside, near the bottom edge |
| Feature adoption (%) | 33.00 | 34.00 | 36.00 | 39.00 | Above the band |
The quartiles use the inclusive method (Python's statistics.quantiles(values, n=4, method='inclusive')). Three rules turn the table into decisions:
- Inside the band: normal variation; do nothing on this metric.
- Below P25: a problem to investigate this week.
- Above P75: do not celebrate yet. First rule out a tracking change, a one-off campaign and a shift in who is visiting; the next section shows how a shift can create an improvement that does not exist.
In the sample, activation and feature adoption are above the band and week-1 retention sits just inside it. A team that cheers for activation while retention has not moved should check whether the new users are a different kind of user.
| Metric | P25 | Median | P75 | Week 12 |
|---|---|---|---|---|
| Activation rate (%) | 39.55 | 40.90 | 41.80 | 44.60 |
| Week-1 retention (%) | 22.05 | 22.50 | 22.95 | 22.10 |
| Feature adoption (%) | 33.00 | 34.00 | 36.00 | 39.00 |
Sample data: bands from weeks 1 to 11 with the inclusive quartile method; week 12 is the value being judged.
When is an outside benchmark usable?
Before you compare with a published number, check four things.
- Same definition. Is "active" or "retained" defined as you define it?
- Same unit. Is the number a share of page loads, of sessions, of users or of whole websites?
- Same period and population. Which dates, which countries, which devices?
- Stated method and date. Can you find how the number was produced, and when?
Here is a case that fails the second test. Google's Core Web Vitals say a page passes when its Largest Contentful Paint is within 2.5 seconds, Interaction to Next Paint is 200 milliseconds or less and Cumulative Layout Shift is 0.1 or less, each measured at the 75th percentile of page loads. The HTTP Archive's Web Almanac 2024 reports that 43% of mobile and 54% of desktop websites in its dataset passed all three in 2024. Suppose your own monitoring shows 66% of mobile page loads meeting the thresholds. That is not "better than the 43%": your 66% is a share of page loads, while the 43% is a share of websites, where a site either passes at the 75th percentile or does not. The comparable figure from your side is one yes or no for your whole site, and the honest statement is "our mobile site passes at the 75th percentile, as 43% of websites in the dataset do".
The same test applies to any retention or conversion benchmark quoted in a report: ask what the denominator is, because a share of carts and a share of checkouts started are different numbers even when both are called abandonment.
How do you stop a mix shift from fooling you?
An overall metric can move for a reason that has nothing to do with the product: the mix of people changed.
Sample data: a product has mobile and desktop users with different activation rates.
| Week | Mobile share | Mobile rate | Desktop share | Desktop rate | Overall |
|---|---|---|---|---|---|
| A | 60% | 30% | 40% | 55% | 0.6 × 30 + 0.4 × 55 = 40.0% |
| B | 40% | 29% | 60% | 54% | 0.4 × 29 + 0.6 × 54 = 44.0% |
The overall rate rises four points, from 40.0% to 44.0%, while both segments got a point worse. The product did not improve; the audience moved toward desktop users, who activate more often. Compare the same segment week to week, and when you report an overall number, report the mix beside it. Three other traps:
- Seasonality. Compare the same weekday and, for annual patterns, the same period last year, not the previous month.
- Small samples. A weekly rate based on 40 people can swing by ten points. Pool weeks or lower the granularity until each point has at least a few hundred people.
- Definition drift. If the tracking changed in week 8, the band before and after is not one series. Mark the date and rebuild the band.
How unstable a small sample is can be calculated: the 95% margin of error of a rate is about 1.96 × √(p × (1 − p) ÷ n). When the true activation rate is 40%, a week of 40 people has a margin of about ±15.2 points and a week of 400 people about ±4.8 points. A ten-point swing in a 40-person week can therefore be noise alone, while the same swing in a 400-person week deserves a look.
Overall rate up, every segment down
sample activation rateHow do you set a target from a benchmark?
Use the band to set a target you can defend. For a metric below P25, aim first for the median, since that has been normal for you. For a metric already inside the band, choose a target at P75, which you have already reached in a quarter of recent weeks. A target far above anything in your history needs a hypothesis and a plan, not just a number.
Sample data: week-1 retention has a median of 22.50% and a P75 of 22.95%. A target of 25% would be well above every one of the 12 weeks (the best was 23.4%), so it belongs in a project with a hypothesis, not in a dashboard goal. A target of 23.0% is a realistic first step.
How do you do this in TapCub?
TapCub supplies your side of every comparison above. It does not provide a dataset of other companies' product metrics, so the outside half comes from published sources checked with the four tests.
- Save each metric once. In All-platform analytics › Behavior › Metrics & SQL, define each rate as a saved metric (an event plus an aggregation such as unique people, or a formula), so the definition lives in one place and every chart uses it.
- Read the weekly series. In All-platform analytics › Behavior › Behavior analysis, chart the metric by week for the last 12 weeks, and use the table to read the values for the quartile calculation. The retention report gives week-1 return by cohort, and the lifecycle view separates new, returning, resurrecting and dormant users so you do not mix them.
- Split by segment. Break the same chart down by device or source, and compare against the previous period or the same period last year, optionally aligned by weekday, to check for the mix shift above.
- Mark tracking changes. Add every release or tracking change in Configuration › Annotations, so the series is read in sections, not as one line.
- Compare Core Web Vitals correctly. Monitoring › Performance shows real-user vitals for your own site; read the 75th percentile values, not the share of loads, before you compare with a published figure.
FAQ
What is product benchmarking?
Comparing your product's measurements with a reference point, such as your own history, a published dataset or a rival's features. This guide covers usage metrics: activation, retention, feature adoption, task time, errors and support contacts.
How do you benchmark a product?
Choose four to six metrics with written definitions, build a band from your last 12 weeks (P25 to P75), judge new values against it and test any outside benchmark for definition, unit, period and method before comparing.
What is a good benchmark for product metrics?
Your own history under a fixed definition is the most reliable one. Published figures help only if the unit and definition match yours; for example, the Web Almanac's 43% of mobile websites passing Core Web Vitals is a share of websites, not of page loads.
How often should you benchmark?
Weekly for the series and the band, quarterly for target-setting and outside comparisons. Rebuild the band whenever tracking, definitions or the product's main audience change.
Sources
- HTTP Archive, Web Almanac 2024: Performance — Core Web Vitals pass rates, 43% of mobile and 54% of desktop websites in 2024. Checked 2026-11-21.
- web.dev, Web Vitals — the good thresholds and the 75th percentile rule. Checked 2026-11-21.
- Python documentation, statistics.quantiles — the inclusive method used for the quartiles. Checked 2026-11-21.
Was this article helpful?
We use your answers to fix and expand this page.
Couldn’t send. Please try again in a minute.
Thanks for the feedback. We’ll use it to improve this page.You’ve already sent feedback on this page. Thanks.

Product Experience Specialist
Writes about product experience, practical workflows, and growth, turning complex processes into clear steps for everyday decisions.