Try it on your own data
Every report in this article is in the free plan. One snippet for web and apps, up to 10 sites.
Start freeCompetitor benchmarking compares your metrics with the same metrics for other companies, measured the same way, to decide which gaps deserve work. It only works on public, comparable data, because a gap between two differently defined numbers means nothing. Below: four steps, the public sources that qualify, and an example where a 17% gap disappears once traffic mix is matched.
What you will learn
- Benchmark only on public, comparable, same-definition data; treat private figures as context
- Match traffic mix before reading a gap: a blended rate mostly reflects where visitors came from
- Refresh each benchmark on its source's own cadence and record source, date, definition and segment
What is competitor benchmarking, and what is it for?
Competitor benchmarking compares one of your metrics with the same metric for other companies in your market, measured the same way, so you can see where you stand and which gaps are worth closing. The output is not a verdict of "better" or "worse". It is a short list of metrics worth working on, and a list of metrics where the comparison tells you nothing.
That second part is where most benchmarking goes wrong. Teams gather every number they can find about rivals, line it up against their own, and chase the biggest gap. But a gap only means something if the two numbers are defined the same way, cover similar customers and come from a source anyone can check. The rule this guide builds on: benchmark only on public, comparable, same-definition data, and treat everything else as a guess. Below are four steps, the public sources that qualify, a worked example in which a 17% gap disappears once the traffic mix is matched, and how often to refresh.
Which companies count as competitors in the first place is covered in direct vs indirect competitors; the general method and vocabulary are on the benchmarking page.
The four steps
- Write the question first. "Is our checkout slow compared with similar stores?" is a question; "see how we compare" is not. The question decides the metric and the peer group. One question per benchmark keeps the result usable.
- Pick peers and metrics that can be compared. Choose five to ten companies of similar size, audience and business model; a single giant or a single start-up makes the median meaningless. Keep only metrics that are public or modelled from public data, and that have one agreed definition (conversion rate of what, over what denominator).
- Collect with a log. For every number record the source, the date, the definition and the segment (all traffic, mobile only, one channel). A benchmark without these four fields cannot be refreshed or defended.
- Place yourself in the spread, then decide. Compute the peer median and range, and your position (how many peers you beat, your gap to the median). Then choose one of three outcomes: close the gap, accept it deliberately, or discard the comparison because the definitions did not match.
A fifth step is the one people skip: write down the decision the benchmark changed. A comparison that changes no decision should not be repeated next quarter.
Which public data can you benchmark on?
Not all public numbers are equal. Measured data, such as real-user performance, can be compared directly. Modelled data, such as third-party traffic estimates, can show direction but not exact size. Self-reported data, such as company claims, needs a second source. The table lists sources that are public, free to read and stable enough to repeat; check each source's own refresh schedule.
Two of these deserve a closer look. Google's Core Web Vitals give a rare case of a shared, exact definition: a page is "good" when the 75th percentile of page loads meets all three thresholds, separately for mobile and desktop. Largest Contentful Paint should be within 2.5 seconds, Interaction to Next Paint at or under 200 milliseconds and Cumulative Layout Shift at or under 0.1, according to Google's web vitals documentation. The Chrome User Experience Report publishes real-user data for origins that are publicly discoverable and have enough visitors, so a peer's score can be looked up if it qualifies. At industry level, the U.S. Census Bureau's Quarterly Retail E-Commerce Sales report gives e-commerce sales as a share of total retail sales; when checked on 2026-11-18 the page showed 17.1% of total retail sales for the second quarter of 2026 (seasonally adjusted). That is a market-level benchmark for "how fast is online retail growing as a share", not a benchmark for your conversion rate.
Metrics that are mostly private (a rival's conversion rate, revenue per visitor, churn) are not on this list. If a report offers them, ask where the number came from; if the answer is a panel of unnamed companies, use it as context, not as your target.
| Source | What it gives | Kind of data | Watch out for |
|---|---|---|---|
| Core Web Vitals and the Chrome UX Report | Real-user LCP, INP and CLS at the 75th percentile, for qualifying origins | Measured | Only origins that are publicly discoverable and have enough visitors appear |
| U.S. Census Bureau retail e-commerce report | Online sales as a share of total retail sales, quarterly | Measured, industry level | Market-wide; not a benchmark for your conversion rate |
| Company filings (SEC EDGAR) | Revenue, growth and margins of listed peers | Self-reported, audited | Only listed companies; fiscal periods differ |
| App store pages | Ratings, review counts and update history | Public, user-generated | Rating scales and review volumes are not like for like across stores |
| Third-party traffic or keyword estimates | Approximate visits and ranking keywords | Modelled | Direction only; tools disagree with each other |
Check each source's own refresh schedule before planning a repeat.
Worked example: a 17% gap that disappears
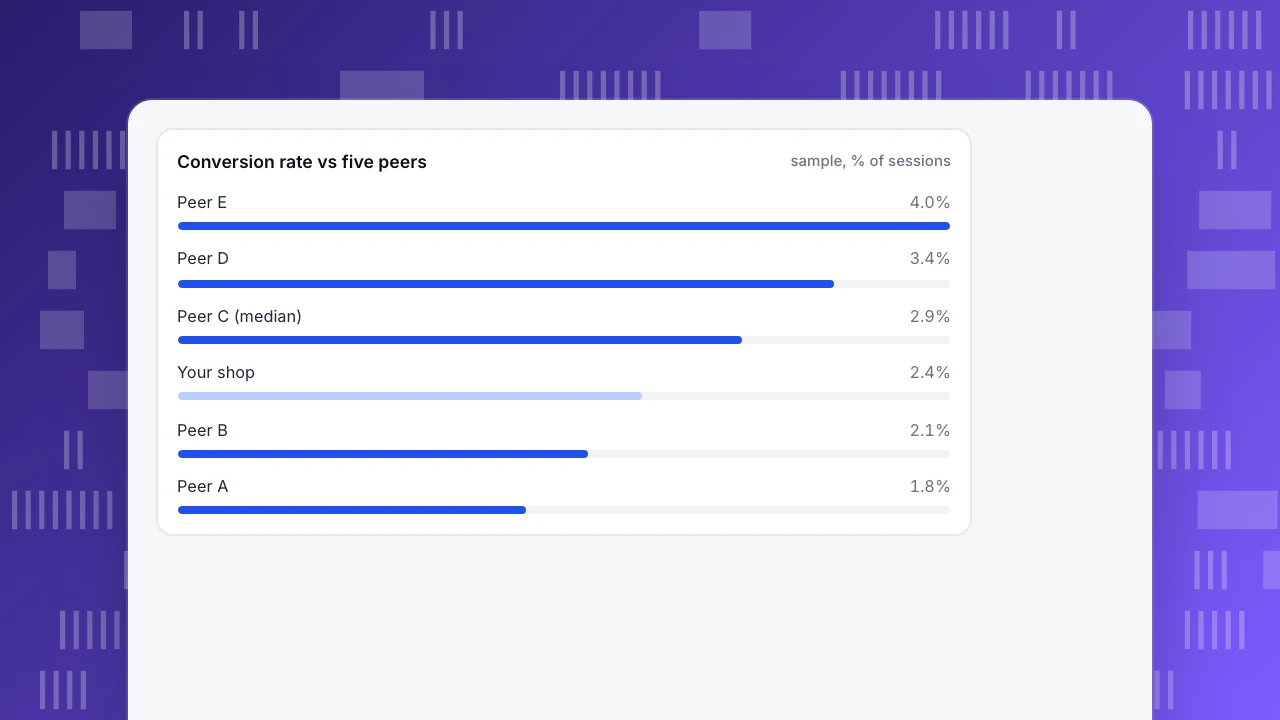
Sample data: an online shop converts 2.4% of sessions to orders. A public report of five similar shops gives conversion rates of 1.8%, 2.1%, 2.9%, 3.4% and 4.0%.
| Measure | Calculation | Result |
|---|---|---|
| Peer median | middle of 1.8, 2.1, 2.9, 3.4, 4.0 | 2.9% |
| Your gap to the median | 2.4 ÷ 2.9 − 1 | −17.2% |
| Your position | above 2 of 5 peers (1.8, 2.1) | 3rd from the bottom of 6 |
At face value the shop is 17% behind and should work on conversion. Before acting, check whether the numbers cover the same traffic. The shop's 12,000 sessions come from three channels:
| Channel | Sessions | Conversion rate | Orders |
|---|---|---|---|
| Paid social | 6,000 | 1.5% | 90 |
| Organic search | 5,000 | 3.0% | 150 |
| 1,000 | 5.0% | 50 | |
| Total | 12,000 | 2.4% (290 ÷ 12,000 = 2.42%) | 290 |
Half of this shop's sessions are paid social, the lowest-converting channel. Suppose the peer report states that its shops get 30% of sessions from paid social, 50% from organic search and 20% from email. Weighting this shop's own channel rates by that mix gives 0.30 × 1.5% + 0.50 × 3.0% + 0.20 × 5.0% = 0.45% + 1.50% + 1.00% = 2.95%. That is 2.95 ÷ 2.9 − 1 = +1.7% against the median, above three of the five peers. The 17% gap was almost entirely traffic mix, not a weaker checkout.
The decision changes: do not rebuild the checkout. If anything is worth examining, it is the 1.5% on paid social, and the question for it is whether half the sessions should come from that channel. This only works when a source reports channel mix; if it does not, compare a single channel only when the source states the same channel definition, or discard the comparison.
Conversion rate vs five peers
sample, % of sessionsBenchmark against yourself first
For most teams the most reliable benchmark is their own history, because the definition, the segment and the tracking never change between the two numbers. Two comparisons do most of the work: against the previous period, to catch changes, and against the same period a year earlier, to remove seasonality.
Sample data: this month's conversion rate is 2.4%, last month's was 2.6% and the same month last year was 2.0%. Against last month, 2.4 ÷ 2.6 − 1 = −7.7%. Against last year, 2.4 ÷ 2.0 − 1 = +20.0%. Read together, the shop is down slightly month on month and clearly up year on year, which is a different story from either number alone. The year-over-year page explains why the same-period comparison matters for seasonal businesses.
Use your own trend to set targets and public peers to ask whether the target is sensible. If the trend improves while you stay below the peer median for a like-for-like segment, the gap is a real opportunity; if you are above the peers and flat, the next gain probably comes from outside conversion.
How often should you refresh a benchmark?
Refresh on the rhythm of the source, not of the calendar.
- Industry-level reports such as the Census e-commerce series are published quarterly; reading them more often adds nothing.
- Real-user performance data moves continuously; a monthly check is enough unless you ship a major change.
- Your own metrics should be compared every month and every quarter, against both the previous period and the same period last year.
- The peer group itself needs a review once a year: companies grow out of comparability, merge or close.
Also refresh when your own definition changes: a new conversion event, a new bot filter or a new channel rule makes old numbers incomparable with new ones. Mark the date of the change on your charts, and keep a note of why a line moved. A benchmark audit of the whole setup is described in web analytics audit.
Common mistakes
- Comparing different definitions. "Conversion rate" can divide by sessions, visitors or clicks; the number is meaningless until the denominator matches.
- Comparing with the best only. One standout company sets a target nobody in your size class reaches; use the median and the spread.
- Ignoring traffic mix. As above, a blended rate mostly reflects where the visitors came from.
- Counting automated traffic. Bots and crawlers inflate visitor counts and drag down conversion rates; a benchmark is only comparable if both sides count people only.
- Using someone else's private data. Leaked figures or scraped dashboards are neither reliable nor safe to rely on; stay with public sources.
- Benchmarking without a decision. If no outcome is attached, the exercise produces a spreadsheet and nothing else.
- Chasing a gap that is a strategy. A rival that sells cheaply at low margin will convert differently from a premium seller; a gap can be a deliberate choice.
Building the benchmark with TapCub
Take the shop above. TapCub does not provide competitor data or industry benchmark values, so the peer numbers come from public sources. What TapCub gives you is the your-side half: clean, consistently defined numbers to put next to them.
- Match the definition. Define the conversion as a goal under Web analytics › Goals so the same event feeds every report. Automated traffic is counted separately from people (see Web analytics › Bots), so visitor counts and conversion rates are not diluted by crawlers.
- Split by channel. In Web analytics › Sources, the channel table shows visitors, sessions and conversions per channel, which gives you the channel rates that make a like-for-like comparison possible.
- Compare with yourself. The date header on each report has a comparison switch: off, previous period, or the same period last week. For a year-on-year view, set a custom date range for the same period last year and read the two ranges side by side. Retention and ROI reports default to the last 7 days, so set the range before you read them.
- Check performance against public thresholds. Monitoring › Performance shows real-user Core Web Vitals, which you can compare with Google's thresholds and with a peer's published CrUX numbers.
- Mark what changed. Add a note under Configuration › Annotations for a release or a campaign so a line's move can be explained later. Industry packs (see industry template) install ready-made metric definitions and dashboards; they are a starting point for definitions, not a source of benchmark values.
TapCub does not scrape or estimate competitor traffic; it measures your own side consistently.
FAQ
What is competitor benchmarking?
Competitor benchmarking compares your metrics with the same metrics for other companies, using the same definition, so you can see where you stand and which gaps matter. It is a comparison for deciding what to work on, not a ranking. Public, comparable data is the only basis worth trusting.
How do you do a competitor benchmark?
Write the question, choose five to ten comparable companies, and keep only metrics that are public and defined the same way. Record source, date, definition and segment for each number, then compute the peer median and your position, and choose to close the gap, accept it or discard the comparison.
What metrics should you benchmark against competitors?
Those you can measure the same way on both sides: Core Web Vitals, app store ratings and review counts, market-level online sales share, and, for listed companies, revenue growth from their filings. Private metrics such as a rival's conversion rate should only be used as context.
How often should you benchmark your competitors?
Match the source: quarterly for industry reports, about monthly for performance data, and monthly and quarterly for your own numbers. Review the peer group once a year, and refresh whenever your own definition changes so old and new numbers stay comparable.
Is it legal to benchmark against competitors?
Using public information such as filings, published reports, public web pages and app store pages is ordinary market research. Obtaining a rival's confidential data is a different matter and can create legal and ethical problems. This is general information, not legal advice; check with counsel if unsure.
See also: SWOT analysis definition: the four boxes and a worked example.
See also: How to See a Competitor's Website Traffic: What You Can and Cannot Know.
See also: Comparing Website Traffic: How to Compare Two Sites Fairly.
Sources
- Google, Web Vitals, web.dev.
- Google Chrome for Developers, Chrome UX Report (CrUX).
- U.S. Census Bureau, Quarterly Retail E-Commerce Sales.
- U.S. Securities and Exchange Commission, Search filings (EDGAR).
Was this article helpful?
We use your answers to fix and expand this page.
Couldn’t send. Please try again in a minute.
Thanks for the feedback. We’ll use it to improve this page.You’ve already sent feedback on this page. Thanks.

Product Experience Specialist
Explores usability, user journeys, and feature adoption through practical examples of onboarding and everyday product use.