Try it on your own data
Every report in this article is in the free plan. One snippet for web and apps, up to 10 sites.
Start freeYou cannot see a competitor's exact website traffic; you can only see estimates and ranks, and both carry error. Public methods differ in what they measure, ranks move daily, and about a third of English Wikipedia's 2025 requests were not human. Calibrate any estimator on sites whose traffic you know before trusting a gap between you and a competitor.
What you will learn
- Exact traffic exists only in the owner's analytics; outside you see model estimates, rankings or telemetry
- Ranks move daily (up to 29% in 39 days for a top-40 domain) and 35.6% of English Wikipedia's 2025 requests were not user traffic
- Test the estimator on three sites you know; trust a gap only if it exceeds the ratio range you measure
Can you actually see a competitor's website traffic?
Not exactly. Exact visitor counts exist only inside the site owner's analytics, so everything you can see from outside is an estimate or a rank. The honest question is therefore not "what is their traffic" but "how wrong could this estimate be, and is the gap between us big enough to survive that error".
There is one useful exception for calibrating your expectations. Wikimedia publishes its own page views openly, so you can see what a real, owner-published number looks like next to what an outside estimator would guess. We use it below.
Which methods estimate someone else's traffic, and what does each measure?
Five kinds of public data cover most of what you will find. Each measures something slightly different, which is why two tools disagree about the same site.
| Method | Where the data comes from | What you get | Main limit |
|---|---|---|---|
| Blended panel estimate | One provider describes mixing first-party analytics from site owners, anonymous data from software installed on millions of devices, public data and partner data | Visit estimates, usually monthly | A model output; panel and partner mix is not published per site |
| DNS-based ranking | Cloudflare Radar ranks domains from anonymized lookups on its public 1.1.1.1 resolver; the metric is the estimated size of the user population that looks a domain up | An ordered top 100, then unordered rank buckets from the top 200 to the top 1,000,000 | Buckets are unordered inside; it counts lookups from resolver users, not visits |
| Aggregated top list | Tranco averages several providers' rankings over the previous 30 days into one list of one million domains | A single rank per domain | Built to be stable, but still only a rank |
| Browser telemetry | The Chrome User Experience Report aggregates experiences of eligible Chrome users on pages and origins that are publicly discoverable and sufficiently popular | Performance distributions, a coarse popularity bucket in BigQuery | No visit counts; Chrome does not publish what share of users are eligible |
| Owner-published counters | The owner publishes it, as Wikimedia does through its pageviews API | Exact counts, split by user and automated traffic | Only exists when the owner chooses to publish |
Read the first row carefully. The provider's own description says the estimate comes from combining several sources, which means a number for a mid-size site rests on a model, not a count.
How to use the table before you pick a tool: first decide which question you are asking. If it is "who is bigger by a wide margin", a rank bucket may be enough, and it costs nothing. If it is "roughly how many visits", you need a blended estimate and the calibration below. If it is "how fast does their site load for real users", browser telemetry answers it directly, and no estimate of visits is involved. Matching the question to the method removes most of the disappointment people feel with traffic tools, because most of it comes from asking a rank to behave like a count.
| Method | What it measures | Gives you | Main limit |
|---|---|---|---|
| Blended panel estimate | Mix of site-owner analytics, device software, public and partner data | Monthly visit estimate | Model output; per-site mix not published |
| DNS-based ranking | Estimated user population looking a domain up on a public resolver | Ordered top 100, then unordered buckets | Lookups, not visits; no order inside a bucket |
| Aggregated top list | Average of several rankings over 30 days | One rank per domain | A rank, not a count |
| Browser telemetry | Experiences of eligible Chrome users on popular public pages | Performance data, coarse popularity bucket | No visit counts |
| Owner-published counters | The owner's own page view counts | Exact counts by agent type | Only if the owner publishes |
Descriptions are taken from each provider's own documentation, checked 2026-11-20.
How wrong can a traffic estimate be?
We could not find a public, independent accuracy study that tests commercial estimators against known traffic, so this article does not quote an error percentage. What public data does show is how unstable even ranks are, and how much of web traffic is not human.
Ranks move every day. We pulled Tranco's rank history on 2026-11-19 for five domains, 39 daily lists from 2026-10-12 to 2026-11-19:
| Domain | Lowest rank number (best) | Highest rank number (worst) | Swing |
|---|---|---|---|
| wikipedia.org | 31 | 40 | 29.0% |
| nytimes.com | 154 | 163 | 5.8% |
| mozilla.org | 89 | 95 | 6.7% |
| example.com | 165 | 186 | 12.7% |
| sciencedirect.com | 216 | 235 | 8.8% |
Swing = (worst − best) ÷ best. These are domains near the top of a list that was designed to be stable, and the rank still moves by up to a tenth. The Tranco authors note that the rankings they combine disagree on which domains rank highest, can change significantly on a daily basis and can be manipulated.
A large share of requests is not human. Wikimedia's API gives page views for English Wikipedia for 2025 under two agent filters. "User" views total 85,541,514,536; "all agents" total 132,913,760,903. So 85.54 ÷ 132.91 = 64.4% of counted views were user traffic and 35.6% came from spiders and automated agents, using Wikimedia's own detection. A tool that cannot separate the two will overstate human visits, and you cannot tell from outside which way a given estimator leans.
Worked example: calibrate an estimator on sites whose traffic you know
Sample data. The only way to put an error bar on an estimator is to test it on sites where you know the true number. Pick three sites you own or have analytics access to, look up the estimator's monthly visits for each, and divide.
| Site | True monthly visits | Estimator says | Ratio (estimate ÷ true) |
|---|---|---|---|
| A | 42,000 | 61,000 | 1.45 |
| B | 8,500 | 3,100 | 0.36 |
| C | 120,000 | 98,000 | 0.82 |
The geometric mean of the three ratios is 0.76, so on average this estimator under-reads, but the individual ratios run from 0.36 to 1.45, a factor of 4.0 between worst under-read and worst over-read. Now apply it:
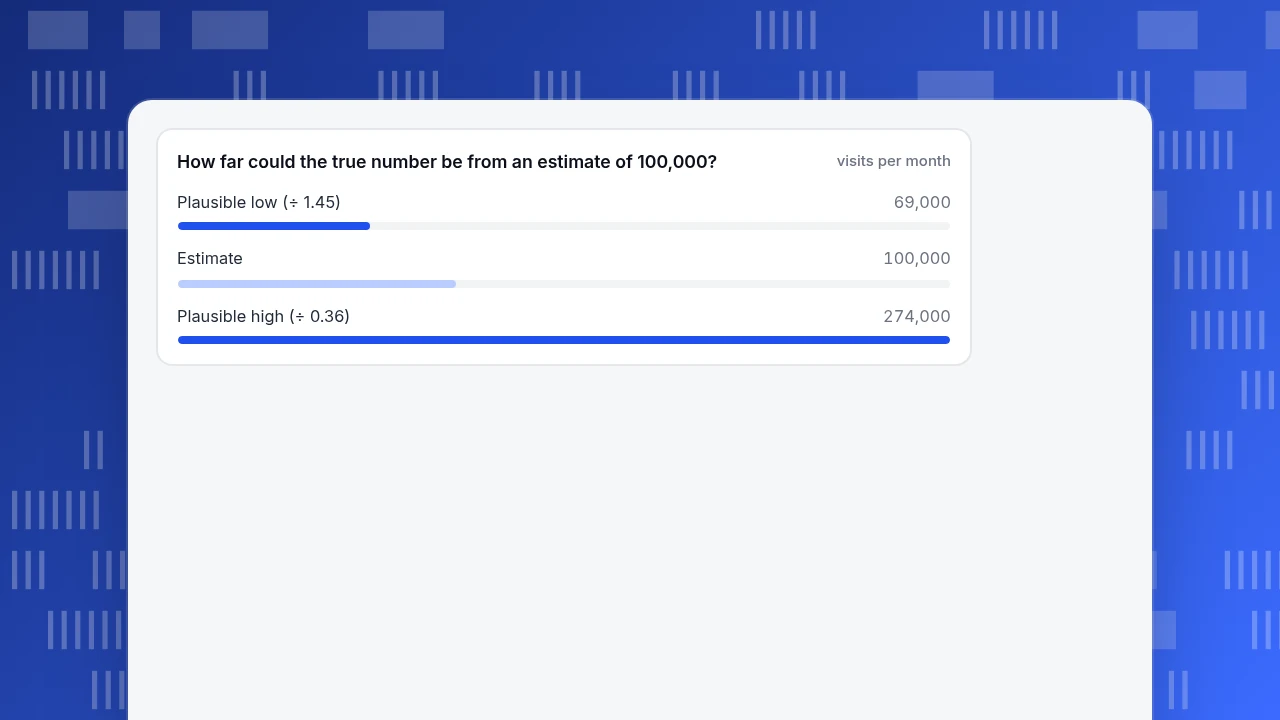
- A competitor shows an estimate of 100,000 visits. True traffic could be 100,000 ÷ 1.45 = about 69,000 up to 100,000 ÷ 0.36 = about 274,000.
- Your own analytics say 60,000. The competitor is certainly bigger only if est ÷ 1.45 > 60,000, which means an estimate above 87,000 (60,000 × 1.45).
- The competitor is certainly smaller only if est ÷ 0.36 < 60,000, which means an estimate below 21,600 (60,000 × 0.36).
- Between 21,600 and 87,000 the honest answer is "cannot tell". Here 100,000 is outside the unknown zone, so "they are bigger than us" is safe, but "they are four times bigger" is not.
Three test sites is a small sample; use more if you can, and keep to sites of similar size to the competitor, because accuracy can differ with size; in this sample the smallest site had the largest miss, though three sites prove nothing.
How far could the true number be from an estimate of 100,000?
visits per monthWhat can you learn without trusting a visit estimate?
Use signals that do not depend on an estimator's model.
- Presence in browser telemetry. CrUX only includes origins that are publicly discoverable and meet a popularity threshold it does not disclose. If the competitor's origin appears in CrUX (for example through PageSpeed Insights), it has enough Chrome visitors to be measured; that is a floor, not a count.
- Rank bucket as order of magnitude. A site in Cloudflare Radar's top 10,000 bucket and one in the top 1,000,000 bucket differ by orders of magnitude in resolver popularity. Do not rank sites inside the same bucket, because contents are intentionally unordered.
- Direction over level. Compare the same site to itself month to month using one tool. The calibration ratio is likely more stable across months than the level is across tools. This is a working assumption, so test it on your own known sites.
- Published numbers. Check whether the owner publishes anything: a public stats page, an API, a filing or a press kit. Wikimedia shows what exact looks like.
- Source mix, not volume. Ask how they get traffic (search, direct, referral, social) rather than how much. Your own source report gives the shape to compare against.
See competitor benchmarking for the metrics worth comparing once you accept the error bars, and how to check website traffic for your own site.
What can you measure exactly, and where does TapCub fit?
TapCub cannot see a competitor's traffic. It measures your own site exactly, and that is what makes calibration and comparison possible.
- In Web analytics › Overview, note your monthly visitors and sessions. Because recognised bots and AI crawlers are counted separately in Web analytics › Bots, your human numbers are not inflated by automated traffic, which is the same split the Wikimedia example showed matters.
- Look up your own domain in the estimator you plan to use and divide, as in the table above. Do this for any other site you can access, with permission, to build the ratio range.
- In Web analytics › Sources, read your split by channel and UTM. Use it to compare the shape of your traffic with what you can infer about a competitor, instead of comparing totals.
- Use Configuration › Annotations to mark launches and campaigns on your charts, so a jump in your own numbers is not mistaken for a market shift.
- Share a read-only view of selected modules through Configuration › Settings › Public sharing when you want to show a partner or investor your real numbers.
FAQ
Can you see exactly how much traffic a competitor gets?
No. Exact counts exist only in the owner's analytics, or when the owner publishes them, as Wikimedia does. Everything else is an estimate from a model or a rank from sampled data, and should be read with an error range.
How accurate are website traffic estimators?
We found no public independent study that quantifies it, so test it yourself. In the sample calibration, three known sites gave ratios between 0.36 and 1.45, a fourfold spread. Calibrate on three or more sites you can verify, preferably of similar size to the competitor.
Is a top-1,000,000 list the same as traffic?
No. It ranks domains by popularity signals, such as lookups on a DNS resolver or averages of several providers' rankings, not by visits. Ranks can move daily, and in Cloudflare's lists the order inside a bucket is intentionally not shown.
Does competitor traffic include bots?
It depends on the tool, and the tool does not usually tell you. Wikimedia's data shows 35.6% of English Wikipedia's 2025 counted requests were not user traffic, so an estimator that includes automated requests would overstate human visits.
What is better than raw traffic for comparing with a competitor?
Direction and mix. Track the same site month to month in one tool, compare source mix, and keep your own exact numbers as the anchor. Use estimates only for gaps larger than your calibration range.
Sources
- Similarweb. Our data — the provider's description of the sources it blends. Checked 2026-11-20.
- Cloudflare. Goodbye, Alexa. Hello, Cloudflare Radar Domain Rankings — resolver-based popularity and unordered buckets. Checked 2026-11-20.
- Tranco. A research-oriented top sites ranking hardened against manipulation — 30-day average, daily instability and manipulation findings; rank history queried through its API on 2026-11-19.
- Google Chrome. CrUX methodology — user, origin and page eligibility. Checked 2026-11-20.
- Wikimedia. Pageviews analytics API — monthly views for en.wikipedia,
userandall-agents, queried 2026-11-20.
Was this article helpful?
We use your answers to fix and expand this page.
Couldn’t send. Please try again in a minute.
Thanks for the feedback. We’ll use it to improve this page.You’ve already sent feedback on this page. Thanks.

Data Analyst
Explores traffic sources, conversion funnels, and retention, using clear metric definitions and concrete examples to explain what the numbers mean.