Try it on your own data
Every report in this article is in the free plan. One snippet for web and apps, up to 10 sites.
Start freeSegmentation, targeting and positioning (STP) is the sequence of splitting a market into groups, choosing which to pursue and stating what you are to them. This guide works one analytics SaaS through it: four segments scored on activation, paid conversion, plan value and retention, a confidence-interval check on what the data can and cannot prove, and a positioning statement with a measurable proof point. In the sample, online stores score 93.9 and win; agencies need more trials before any claim.
What you will learn
- Score segments on behaviour (activation, conversion, plan value, retention), not on guesses; online stores scored 93.9 against 80.8 for agencies
- Check intervals before claiming a difference: stores (11.0-17.7%) beat publishers (5.4-11.3%) but not agencies (8.2-17.8%)
- A positioning statement is a testable claim; fill the proof from your own data, such as 63% activated within 7 days
What are segmentation, targeting and positioning?
Segmentation, targeting and positioning (STP) is a three-step sequence for deciding who you sell to and what you say to them. Segmentation splits a market into groups that respond differently. Targeting chooses which of those groups to pursue first. Positioning states what you are, for whom and against what alternative, so the chosen group can place you in their head.
The ideas are old and specific. Wendell Smith's 1956 Journal of Marketing article (vol. 21, no. 1, pp. 3–8) framed segmentation as adjusting what you offer to fit demand that is already divided into groups, as opposed to differentiating a product and persuading everyone to want it. Ries and Trout's 1981 book Positioning: The Battle for Your Mind shifted the focus of positioning from the product to what the prospect already thinks. The table above shows what each step outputs; here the three steps are worked through one example with numbers.
What makes this guide different from a definition page is the evidence at each step. Every choice below comes from a table you could rebuild from your own signup and usage data: behaviour in the first week, conversion to paid, and retention. If you only have demographic guesses, you can still use the method, but mark each score as an assumption and replace it once data arrives.
| Step | Question it answers | What you produce | Data to use |
|---|---|---|---|
| Segmentation | Which groups respond differently? | A set of measurable, reachable groups | Behaviour cuts, then demographics |
| Targeting | Which group first? | A primary and at most one secondary segment | Size, activation, conversion, value, retention |
| Positioning | What are we to them, against what? | One testable statement with proof | The alternative they use today, your own measured results |
Segmentation describes the market; targeting is the decision; positioning is the claim.
What is the example company and what data do we have?
Sample data. A small web analytics tool, sold as a subscription, had 1,200 trial signups over 90 days. Each trial was tagged with the type of business the person ran. For each type, we know four behaviour cuts, measured from product events and billing:
- Activation: installed the tracking script and saw data within 7 days.
- Paid conversion: became a paying customer by day 60.
- Average monthly plan: what paying customers pay per month.
- 12-month retention: share of paying customers still subscribed 12 months later (from an older cohort that has completed a year).
| Segment | Trials | Activated in 7 days | Paid by day 60 | Paid conversion | Average plan | 12-month retention |
|---|---|---|---|---|---|---|
| Online stores | 420 | 63% | 59 | 14.0% | $59 | 78% |
| Publishers | 330 | 55% | 26 | 7.9% | $39 | 61% |
| B2B SaaS | 270 | 48% | 30 | 11.1% | $79 | 70% |
| Agencies | 180 | 52% | 22 | 12.2% | $99 | 66% |
| All | 1,200 | 137 | 11.4% |
The conversion column is paid ÷ trials: 59 ÷ 420 = 14.0%, 26 ÷ 330 = 7.9%, 30 ÷ 270 = 11.1%, 22 ÷ 180 = 12.2%, and 137 ÷ 1,200 = 11.4% overall.
How do you choose the segmentation cuts?
A segment is worth keeping only if it passes four tests. Check each cut against them before building anything on top:
- Measurable. You can tell who belongs. "Business type" passes if you capture it at signup; "people who feel overwhelmed" does not.
- Large enough. Big enough to matter and to measure: a cut with 12 trials gives you noise.
- Reachable. You can put a message in front of them without reaching everyone else, through a channel, a keyword or a community.
- Different in response. Segments that behave the same should be merged. The table shows behaviour does differ: 63% activation against 48%, 14.0% conversion against 7.9%.
For how to analyse a segment once you have one, see customer segmentation analysis; for the kinds of cut other businesses use, see market segmentation examples.
Prefer behaviour cuts (what they did in the product) to demographic cuts (who they are) when you have the data, because behaviour predicts what they will do next. Business type was chosen here because it separates behaviour well; test other cuts the same way, for example company age, traffic source or plan size.
One outside check belongs here. If a segment is made of new businesses, part of its churn is not your fault. The U.S. Bureau of Labor Statistics' survival table shows 79.6% of private-sector establishments that opened in the year to March 2016 were still open after one year, 68.8% after two and 50.7% after five. That is a ceiling for any retention figure computed on very young businesses: a 78% 12-month retention in a segment of mostly new shops sits within two points of it, so little of that churn is product-driven. A 61% figure for a segment that is not mostly new businesses is a stronger warning.
How do you score segments to pick a target?
Convert each criterion to an index, where the best segment on that criterion is 1.0, then weight the indexes by how much each criterion matters. The weights below are a judgment call, so write down yours before you look at the scores:
| Criterion | Weight | Why |
|---|---|---|
| Segment size (trials) | 15% | Room to grow |
| Activation | 20% | Product fit shows up first |
| Paid conversion | 25% | Revenue yield per trial |
| Average plan | 15% | Value per customer |
| 12-month retention | 25% | Whether revenue lasts |
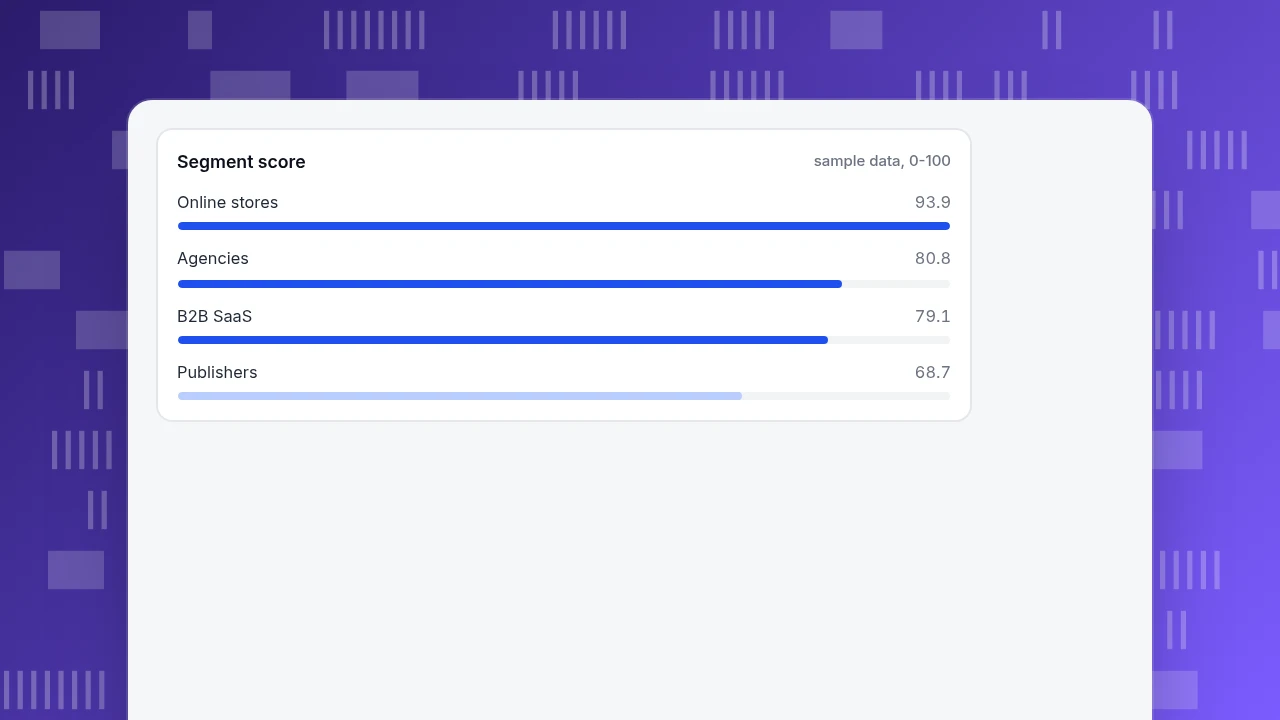
For online stores the indexes are size 420 ÷ 420 = 1.00, activation 63 ÷ 63 = 1.00, conversion 14.0 ÷ 14.0 = 1.00, plan 59 ÷ 99 = 0.60 and retention 78 ÷ 78 = 1.00. The score is 0.15 × 1.00 + 0.20 × 1.00 + 0.25 × 1.00 + 0.15 × 0.60 + 0.25 × 1.00 = 0.939, or 93.9 points. The same calculation for all four:
| Segment | Score | Retained revenue per 100 trials |
|---|---|---|
| Online stores | 93.9 | $646 |
| Agencies | 80.8 | $799 |
| B2B SaaS | 79.1 | $614 |
| Publishers | 68.7 | $187 |
The last column is 100 × paid conversion × 12-month retention × average plan; for stores that is 100 × 0.14 × 0.78 × $59 = $646 a month still being paid after 12 months. Two readings come out of the table:
- Online stores are the primary target. They lead on size, activation, conversion and retention, and contribute the most monthly revenue from this cohort: 59 × $59 = $3,481, against $2,370 for B2B SaaS, $2,178 for agencies and $1,014 for publishers.
- Agencies are the interesting secondary target. They score second on points and best on retained revenue per trial, because the plan is the largest. Their weakness is size: only 180 trials.
Publishers rank last on every revenue measure. That is a reason to stop spending acquisition effort there, not to delete them from the product.
Segment score
sample data, 0-100How sure can you be that segments really differ?
With 59 paying customers out of 420, 14.0% is an estimate, not a fact. A 95% Wilson confidence interval shows the range the true rate could plausibly sit in:
| Segment | Paid conversion | 95% interval |
|---|---|---|
| Online stores | 14.0% | 11.0% to 17.7% |
| Agencies | 12.2% | 8.2% to 17.8% |
| B2B SaaS | 11.1% | 7.9% to 15.4% |
| Publishers | 7.9% | 5.4% to 11.3% |
The stores interval (11.0% to 17.7%) barely touches the publishers one (5.4% to 11.3%), so "stores convert better than publishers" is a reasonable claim. It overlaps heavily with agencies and B2B SaaS, so do not claim stores convert better than agencies from this data. If agencies matter to you, collect more trials from them before deciding; at 180 trials the answer is simply not settled. This is the rule to use every time: when intervals overlap, treat segments as tied on that metric and decide on the other criteria.
How do you write a positioning statement the segment can verify?
Positioning is a claim, and a claim needs a proof. Use this frame, and fill each blank from the data above:
For [target segment] who [problem], [product] is a [category] that [main benefit], unlike [alternative they use today], because [proof].
For the chosen segment: "For online store owners who cannot tell which channel brings paying customers, this tool is a web analytics product that shows sources, conversion and bots in one place, unlike exporting reports into a spreadsheet by hand, because 63% of store trials see data within 7 days of install."
Check the statement with three questions:
| Question | A weak answer | A usable answer |
|---|---|---|
| What is the alternative the customer compares you with? | "Other analytics tools" | "Exporting reports to a spreadsheet every Monday" |
| What can you prove? | "Easy to use" | "63% reach data in 7 days" (your activation figure) |
| What can they repeat to a colleague? | A feature list | One sentence about the problem solved |
Test the line in the places where the segment looks: the landing page, the ad headline and the first email. Give each segment its own landing page and tag the links so you can compare which message converts. Judge it on the same measures as before (activation, conversion), not on whether the team likes the wording.
How do you run this analysis in TapCub?
Take the stores-versus-agencies question above. TapCub gives you the behaviour half of the table: who signed up, who activated, who converted, split by group. It does not score segments for you, send surveys or run experiments, so the weights stay in your spreadsheet.
- Identify the person. Call
tapcub.loginat signup. Logged-in people appear under All-platform analytics › Users › People with a day-by-day behaviour timeline. Anonymous visitors have no profile, so they are never segment members. - Tag the business type. On All-platform analytics › Users › Segments & tags, the Tags tab assigns one value per person. Record business type there.
- Build one rule segment per cut. Conditions can combine did and did not, properties, tags and first-seen date. Rule segments refresh daily or on demand, and the segment keeps a 30-day size trend.
- Compare funnels by group. In All-platform analytics › Behavior › Behavior analysis, build the funnel signup, script installed, first paid event. Apply a segment as the cohort to read activation and conversion for that group.
- See which channels fill each segment. Web analytics › Sources shows visitors by channel and UTM; tag each segment's landing page and compare.
Keep the sample sizes in view: the interval table above applies to TapCub numbers too.
FAQ
What does STP stand for in marketing?
Segmentation, targeting and positioning. Segmentation divides a market into groups, targeting chooses which group to serve first, and positioning defines what you are to that group compared with the alternatives they know.
What is the difference between market segmentation and targeting?
Segmentation describes the market and gives you a set of groups; targeting is the decision about which of them to pursue. In the example, four segments came from segmentation; choosing online stores first was targeting.
How do you choose a target segment?
Score segments on size, activation, conversion, plan value and retention, weight the criteria, and check whether the differences are bigger than the uncertainty. In the sample, stores scored 93.9 against 80.8 for agencies, but conversion intervals overlapped.
What is a positioning statement?
One sentence saying who the product is for, the problem, the category, the main benefit, the alternative it is compared with and the proof. It is a testable claim, not a slogan.
How many segments should a small company target?
Usually one primary and at most one secondary until the first is working. More than that splits messaging and budgets across groups before you have evidence for each.
Sources
- Wendell R. Smith, Product Differentiation and Market Segmentation as Alternative Marketing Strategies, Journal of Marketing 21(1), 1956: segmentation as adjusting supply to diverging demand.
- Ries and Trout, Positioning: The Battle for Your Mind, McGraw-Hill, 1981: catalogue record.
- U.S. Bureau of Labor Statistics, Business Employment Dynamics: survival of private sector establishments by opening year: 79.6%, 68.8% and 50.7% survival (table checked 2026-11-20, data to March 2026).
Was this article helpful?
We use your answers to fix and expand this page.
Couldn’t send. Please try again in a minute.
Thanks for the feedback. We’ll use it to improve this page.You’ve already sent feedback on this page. Thanks.

Product Adoption Consultant
Explores customer onboarding, live conversations, and self-service, turning common usage questions into practical guidance and improvements.