Try it on your own data
Every report in this article is in the free plan. One snippet for web and apps, up to 10 sites.
Start freeMarket segmentation examples fall into four bases: demographic (who), geographic (where), behavioral (what they do) and psychographic (why). Behavioral and geographic segments are the easiest to build because the data already sits in your analytics. Below: examples of each basis, a worked behavioral split from order data and four tests for whether a segment is worth acting on.
What you will learn
- Sort every example into one of four bases and note which data you can actually observe
- Behavioral splits show unequal value: in the sample, 15% of customers bring 46.4% of revenue
- Check a segment on size, reachability and a different response, with enough people to trust the gap
What are the four bases of market segmentation?
Market segmentation splits a broad market into smaller groups that respond differently to your offer. Wendell Smith described it in 1956 as viewing a heterogeneous market as a number of smaller homogeneous ones. The examples that follow all sort into four bases, and each basis answers a different question about the person.
| Basis | Question it answers | Example segment | Where the data comes from | Hard to observe? |
|---|---|---|---|---|
| Demographic | Who are they? | Women aged 25 to 34; owners of small teams | Sign-up forms, surveys, public statistics | Medium |
| Geographic | Where are they? | Customers in cold-climate regions; one metropolitan area | Address, IP-based place, shipping data | Easy |
| Behavioral | What do they do? | Buyers with four or more orders; visitors who read pricing twice | Event data from your site or app | Easy once tracked |
| Psychographic | Why do they choose? | Buyers who value durability over price | Surveys and interviews | Hard |
Behavioral and geographic data are already in your analytics. Demographic and psychographic data usually are not, which is why most teams start with the first two and add the others through a survey. For how the same ideas apply to people inside a product, see user segmentation examples and audience segmentation.
All segment examples in this guide are illustrative, not drawn from named companies.
What are examples of demographic segments?
Demographic segments sort people by attributes that describe the person, not the behavior:
- Age band. A tutoring service offers evening sessions for adult learners aged 30 to 45 and a separate weekend plan for parents of school-age children.
- Household income. A furniture seller shows an entry line and a premium line to two income bands, with different delivery and financing offers.
- Life stage. A bank page for first-time renters differs from one for first-time buyers.
- Role or company size (B2B). Business segmentation uses the same idea with firm attributes: a scheduling tool talks to solo consultants about price and to 50-person agencies about shared calendars.
Demographics are easy to describe and easy to buy media against, but they are weak predictors when used alone. Two people in the same age band can buy for opposite reasons. Use demographics to decide where to advertise, and behavior to decide what to say.
What are examples of geographic segments?
Geographic segments sort people by where they are. The cheapest version is a place you already collect:
- Region. The U.S. Census Bureau groups states into four regions (Northeast, Midwest, South, West) and nine divisions, a ready-made scheme for national reports.
- Climate or season. A clothing retailer pushes coats to cold regions in October and sandals to warm regions at the same time.
- Urban versus rural. A grocery delivery service sets minimum order values by delivery density.
- Language and country. A software company shows localized pricing and support hours by country.
The limit is precision. If place comes from an IP address, it is reliable at country level and less so at city level, and it describes where the network is, not necessarily where the person lives. Pick a granularity you can trust: country or region is usually enough for planning campaigns.
What are examples of behavioral segments, and what do they look like in numbers?
Behavioral segments sort people by what they did: purchase frequency, features used, pages read, source of first visit, time since last visit. They are the easiest to act on because they are already measured and they predict next behavior better than attributes do. The behavioral segmentation page covers the method; here is what a split looks like.
Sample data: an online store has 20,000 customers in the last 12 months.
| Segment | Customers | Share of customers | Orders per customer | Average order | Revenue | Share of revenue |
|---|---|---|---|---|---|---|
| One order | 11,000 | 55% | 1.0 | $55 | $605,000 | 22.5% |
| Two to three orders | 6,000 | 30% | 2.4 | $58 | $835,200 | 31.1% |
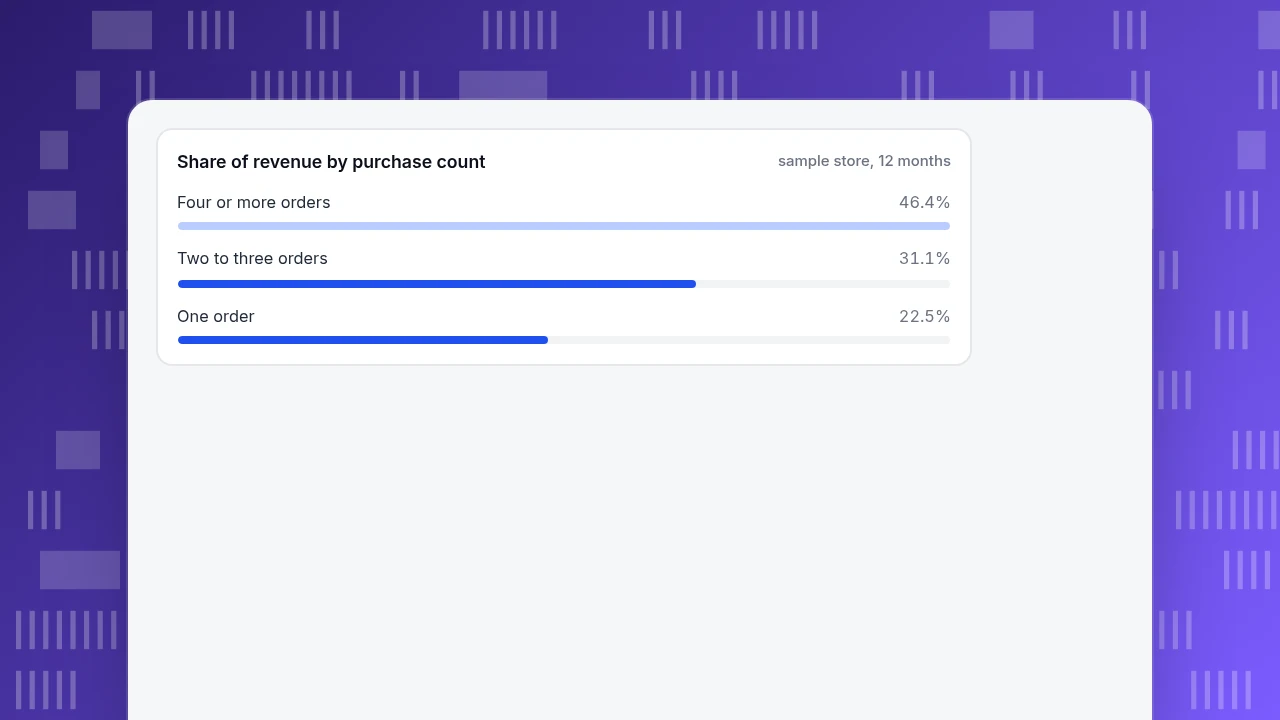
| Four or more orders | 3,000 | 15% | 6.5 | $64 | $1,248,000 | 46.4% |
| Total | 20,000 | 100% | n/a | n/a | $2,688,200 | 100% |
Check one row: 3,000 × 6.5 × $64 = $1,248,000, and $1,248,000 ÷ $2,688,200 = 46.4%. The top 15% of customers bring in 46.4% of revenue, so the one-order group (55% of people, 22.5% of revenue) needs a different message from the repeat group: a reason to place a second order, not a loyalty perk they have not earned yet.
Other behavioral examples: visitors who viewed the pricing page twice in a week; app users who completed onboarding versus those who stopped at step 2; shoppers who arrived from email versus search.
Share of revenue by purchase count
sample store, 12 monthsWhat are examples of psychographic segments?
Psychographic segments sort people by values, attitudes and lifestyle:
- Durability over price. Buyers who read reviews about how long a product lasts, and will pay more for a repair guarantee.
- Convenience seekers. People who choose the fastest delivery option even when it costs extra.
- Early adopters. People who like trying new features before they are polished.
- Cost-conscious planners. People who compare three options and wait for a sale.
Psychographics explain why, which is valuable, but you rarely observe them directly. The practical route is to ask. A short survey of 300 to 500 customers with two or three attitude questions lets you label the people you asked, then check whether those labels line up with behavior you can see (for instance, "durability" buyers should return fewer items). If a label does not match any observable behavior, you cannot target it at scale.
How do you check that a segment is worth acting on?
A segment is useful if it passes four tests. Fail any one and the segment is a description, not a target.
- Measurable. You can say who is in it and count them.
- Large enough. Big enough to move a metric you care about.
- Reachable. There is a channel or a page where you can address it.
- Responds differently. Its conversion, order value or retention differs from the rest.
The fourth test needs a number. Sample data: visitors who read the pricing page twice in a week converted 24 of 400 (6.0%); everyone else converted 9 of 600 (1.5%). That is a fourfold difference (6.0% ÷ 1.5% = 4.0), and a two-proportion z-test gives z of about 3.9, well above the 1.96 that marks a 95% threshold, so the gap is unlikely to be noise.
Compare a small segment: 3 conversions out of 40 visitors is 7.5%, which looks even better, but the 95% Wilson interval runs from 2.6% to 19.9%, too wide to plan on: the true rate could sit close to the 1.5% baseline or far above the observed figure. A rule of thumb: do not build a campaign on a segment until it has at least 100 members and enough conversions that the interval is narrow.
| Test | Question | Sample result |
|---|---|---|
| Measurable | Can you list and count who is in it? | Visitors who read pricing twice in a week: 400 |
| Large enough | Can it move a metric you care about? | Four or more orders: 15% of customers, 46.4% of revenue |
| Reachable | Is there a channel or page to address it? | Email to repeat buyers; on-site banner for pricing readers |
| Responds differently | Does conversion or value differ from the rest? | 6.0% against 1.5%, z about 3.9 |
Sample data. A segment that fails any test is a description, not a target.
What mistakes make market segmentation examples fail in practice?
- Too many segments. Eleven segments with 40 people each cannot be measured. Start with three to five.
- Segments you cannot reach. "Optimistic people" is a label, not a channel.
- Using one basis for everything. Demographics alone cannot find the 15% of customers who bring 46.4% of revenue; purchase count can.
- Static segments. A customer moves from one-order to repeat. Re-run the split monthly.
- Ignoring size. A segment that responds well but contains 0.5% of customers cannot change revenue.
- Counting crawlers as visitors. Bot traffic distorts every conversion rate in the split, especially for small segments.
How do you build these segments in TapCub?
TapCub covers the behavioral and geographic bases directly and can hold the others if you bring the data. Here is how the store above would work through the splits.
- Check place. Web analytics › Audience shows visitors by country, region and city, plus device and language. Place comes from an IP database, and city is not always present, so use country or region for planning.
- Build the behavioral segments. In All-platform analytics › Users › Segments & tags, create rule segments from conditions such as did or did not do an event, a property, first seen, or active. A "four or more orders" segment is a rule on the purchase event. Anonymous visitors have no profile, so they never join a segment; identified customers do.
- Add survey answers. TapCub does not run surveys. Import a CSV of user attributes (for example, the "durability" label from your survey) in All-platform analytics › Data › Data import and use it as a property in rules.
- Compare segments. Open a segment in analysis as a cohort and compare conversion, retention or funnel completion, as in the 6.0% against 1.5% example. For repeat-purchase groups, the ten RFM buckets in Segments & tags (champions, loyal, potential loyalists, new, promising and so on) give a ready-made behavioral split, and moves between buckets are recorded.
Segments tell you who to address; writing the message and choosing the channel stay with your team.
FAQ
What are the four types of market segmentation with examples?
Demographic (women aged 25 to 34), geographic (customers in cold-climate regions), behavioral (buyers with four or more orders) and psychographic (buyers who value durability over price). Each answers a different question: who, where, what they do and why. Most teams begin with behavioral and geographic because the data already exists.
What is an example of market segmentation?
An online store with 20,000 customers splits them by purchase count: 55% bought once, 30% two to three times, 15% four or more. The last group brings 46.4% of revenue, so each group gets a different message. The data here is a sample, but the method works with any store's order data.
How many market segments should a business have?
Three to five to start. Each segment must be large enough to measure and distinct enough to need its own message or offer. If two segments would get the same message, merge them; if a segment has fewer than about 100 people, you cannot judge its response with confidence.
What is the difference between market segmentation and targeting?
Segmentation divides the market into groups; targeting chooses which of those groups to serve and how. You can segment without targeting (describing the market) but not target without segments. Positioning, the message each target hears, comes after both.
Which segmentation basis is the most useful?
It depends on the decision. Behavioral is usually the most actionable for a business with its own site or app, because it is measured and predicts what people do next. Demographic and geographic help decide where to advertise, and psychographic helps with positioning but needs a survey.
See also: Segmentation, Targeting and Positioning (STP): A Worked SaaS Example.
Sources
- Wendell R. Smith. Product Differentiation and Market Segmentation as Alternative Marketing Strategies. Journal of Marketing 21(1), 1956 — the original statement of market segmentation. Checked 2026-11-19.
- U.S. Census Bureau. Census Regions and Divisions of the United States — four regions and nine divisions. Checked 2026-11-19.
Was this article helpful?
We use your answers to fix and expand this page.
Couldn’t send. Please try again in a minute.
Thanks for the feedback. We’ll use it to improve this page.You’ve already sent feedback on this page. Thanks.

Product Experience Specialist
Explores usability, user journeys, and feature adoption through practical examples of onboarding and everyday product use.