Try it on your own data
Every report in this article is in the free plan. One snippet for web and apps, up to 10 sites.
Start freeMarketing analytics is collecting marketing data, joining it to business results and using it to decide where to spend next. Its core question is where the money went and what it brought back. Build it in order: connect channel, cost and conversion; then decide how to share credit; only then forecast. Below: four layers, eight starting metrics and a worked month.
What you will learn
- Connect spend, channel and orders on the same dates before building models or forecasts
- Start with eight metrics per channel, ending with gross profit after spend, not just ROAS
- Compare credit models side by side; a channel that only assists looks weak under last touch
What marketing analytics is
Marketing analytics is the practice of collecting marketing data, joining it to business results and using it to decide where the next dollar goes. Vendor definitions vary in wording but share one thread: connect marketing activity to outcomes such as customers and revenue, across channels, so that spend can be judged and moved.
The useful version is a question you can answer with numbers: where did the money go, and what did it bring back? Everything else, such as dashboards, models and forecasts, is built on being able to answer that for each channel. Teams often start at the other end, with a predictive model or a data warehouse, and then discover they cannot say how much was spent on paid social last month, or which orders came from it. This guide goes in the order that works: connect channel, cost and conversion first, then decide how to give credit, and only then think about prediction.
If you are weighing marketing analytics against analysing how people use a product, that comparison has its own page: product vs marketing analytics. For the list of indicators, see marketing KPIs; for judging a single campaign after it ends, see marketing campaign analysis.
The four layers of marketing analytics
It helps to see marketing analytics as four layers stacked on each other. A layer is only as good as the one beneath it.
| Layer | Question it answers | Data it needs | Output |
|---|---|---|---|
| 1. Measure | How many people came, from where, and what did they do? | Tracking code, campaign tags, goals or orders | Sessions, conversions by channel |
| 2. Connect | What did each channel cost and bring back? | Spend by day, channel and campaign, joined to orders | Cost per order, return on ad spend |
| 3. Credit | Which touch deserves the credit when several were involved? | Conversion paths with channels and time | Results under first, last or shared credit |
| 4. Predict and allocate | Where should the next budget go, and what will it return? | Layers 1 to 3 over enough history | Forecasts, budget shifts, tests |
Most teams that say they "do marketing analytics" have layer 1, and many have layer 4 on a slide. The gap is layer 2: spend and orders in one place, on the same dates, under the same channel names. If you only fix one thing, fix that.
The minimum set of eight metrics
You do not need fifty metrics. These eight, computed per channel and per campaign, answer the core question. The first four describe traffic and cost; the last four describe what it was worth.
| # | Metric | Formula | What it tells you |
|---|---|---|---|
| 1 | Sessions by channel | Count of visits, grouped by channel | Where attention came from |
| 2 | Conversion rate | Orders (or goal completions) ÷ sessions | Whether the visits were the right ones |
| 3 | Spend | Amount paid for the channel in the period | What you put in |
| 4 | Cost per session | Spend ÷ sessions | The price of a visit |
| 5 | Cost per acquisition (CPA) | Spend ÷ orders | The price of an order |
| 6 | Revenue | Sum of order amounts | What came back, before costs |
| 7 | Return on ad spend (ROAS) | Revenue ÷ spend | Revenue per dollar spent |
| 8 | Gross profit after spend | Revenue × gross margin − spend | Whether the channel made money |
The eighth is the one most reports leave out, and it is the one that turns a return ratio into a decision. See ROI and ROAS and cost per acquisition for the first definitions.
Worked example: three channels, one month
Sample data: an online store, one month, last-touch credit, 40% gross margin.
| Channel | Spend | Sessions | Orders | Revenue | CPA | ROAS | Gross profit after spend |
|---|---|---|---|---|---|---|---|
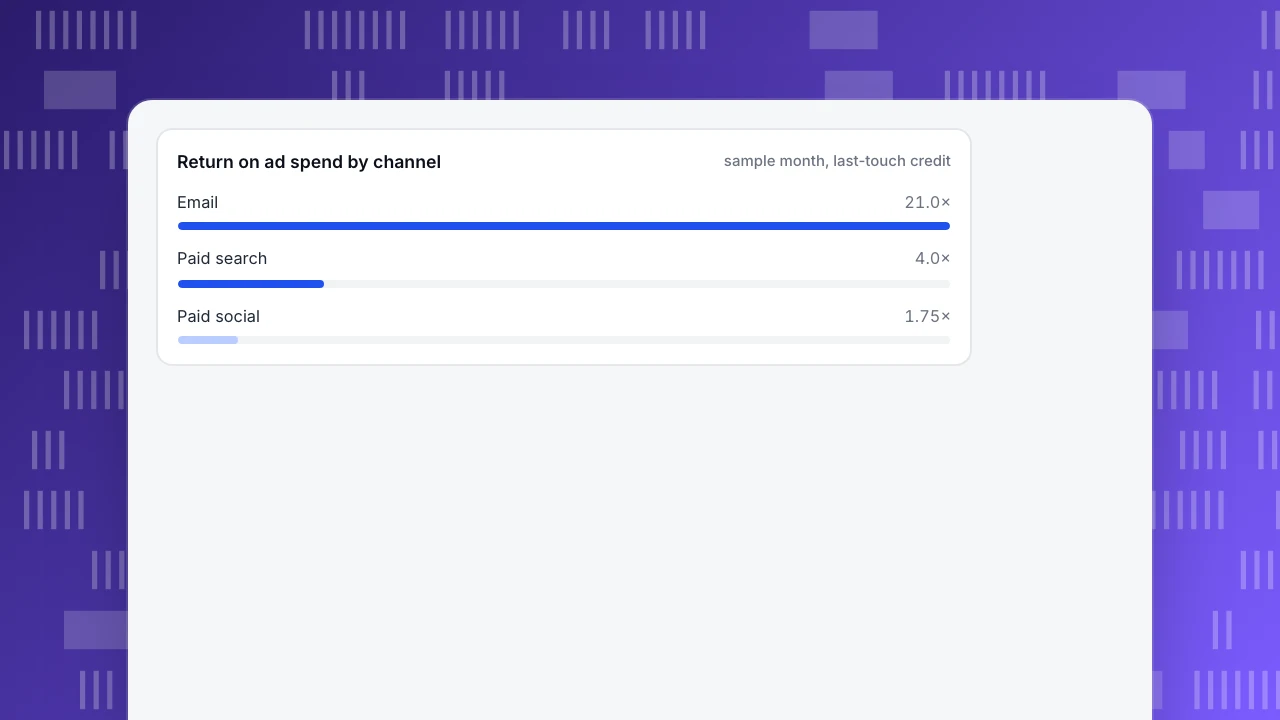
| Paid search | $6,000 | 12,000 | 240 | $24,000 | $25.00 | 4.00 | +$3,600 |
| Paid social | $4,000 | 10,000 | 100 | $7,000 | $40.00 | 1.75 | −$1,200 |
| $500 | 5,000 | 150 | $10,500 | $3.33 | 21.0 | +$3,700 | |
| Total | $10,500 | 27,000 | 490 | $41,500 | $21.43 | 3.95 | +$6,100 |
How to recompute: CPA = spend ÷ orders ($6,000 ÷ 240 = $25.00); ROAS = revenue ÷ spend ($24,000 ÷ $6,000 = 4.00); gross profit after spend = revenue × 0.40 − spend ($24,000 × 0.40 − $6,000 = $3,600). Email's $500 stands for the sending tool and design time, which is why its ratio looks so high.
Three things the table shows that the traffic report alone would not:
- The blended number hides a loser. A total ROAS of 3.95 looks healthy. Paid social at 1.75 sits below the break-even line of 1 ÷ 0.40 = 2.5 and lost $1,200 after the cost of goods.
- Cheap clicks are not cheap orders. Paid social has the lowest paid cost per session ($0.40 against $0.50) and the highest CPA ($40.00 against $25.00), because only 1.0% of its sessions order, against 2.0% for search.
- Orders per session decide it. Email's 3.0% conversion rate comes from people who already know the store; do not read it as proof that more email spend scales.
The decision: cut or rework paid social, hold search, and ask whether email can reach more people rather than send more to the same ones. Notice also what this table cannot say. It uses last-touch credit; if paid social is what introduces shoppers who later buy through search, cutting it may lower search too. That is the question the next two sections answer.
Return on ad spend by channel
sample month, last-touch creditHow to connect channel, cost and conversion
The example only works if three things line up, so build them first:
- Channel names that mean the same thing everywhere. Tag every campaign link with campaign parameters. Google Analytics describes three:
utm_source(the referrer, such as a search engine or newsletter),utm_medium(the marketing medium, such as cost-per-click or email) andutm_campaign(the product, slogan or promotion). Pick spellings once, write them down and use lower case; "Email", "email" and "e-mail" are three different channels to a report. See the UTM glossary entry. - Spend by day, channel and campaign. Monthly totals cannot be matched to orders by campaign. Export daily cost from each ad platform, or log it as you pay.
- Orders in the same place as the visits. Conversions should come from your orders, not from a click counter on the ad platform; platform counts and your orders will not match, and your orders are the ones the finance team can reconcile.
Then spot-check: pick one campaign and one day, find its spend, its sessions and its orders, and see that the arithmetic in the table reproduces.
Who gets the credit when more than one touch is involved
Layer 3 is where analytics gets argued about. A shopper may click a paid social ad on Monday and a paid search ad on Friday before buying. Google Analytics defines attribution as assigning credit for important actions to the ads, clicks and other factors that lead up to them. The common rules:
| Model | Who gets the credit | Good for |
|---|---|---|
| First touch | The channel that introduced the shopper | Judging discovery channels |
| Last touch | The channel clicked just before the order | Judging closing channels; the easiest to audit |
| Linear | Every touch equally | A neutral cross-check |
| Position-based | More to the first and last touches, the rest shared | Paths where both ends matter |
| Time decay | More to touches closer to the order | Long consideration periods |
Sample data: 100 orders follow the path paid social, then paid search. Last touch gives search 100 orders and social 0. Linear gives each 50. Position-based with only two touches gives 50 each as well, because there is no middle to share. Run the two views side by side. A channel that scores far better under linear than under last touch is a helper, and cutting it on last-touch numbers alone is how teams lose search volume after cutting social. Credit rules cannot prove cause, either; only a test with a held-out group can. For a vocabulary of the models, read attribution.
Common mistakes in marketing analytics
- Starting with the model. A forecast built on spend you cannot reconcile is a guess with decimals. Layers 1 and 2 first.
- Reading ROAS without margin. A 1.75 can be a win at 80% margin and a loss at 40%. Always show gross profit after spend next to it.
- Trusting platform-reported conversions as the total. Each ad platform claims its own conversions; add them up and you will claim more orders than you took. Reconcile to your own order records.
- Different channel names in different tools. A report cannot join "paid_social" to "Paid Social" or "fb".
- Averaging across channels. A blended CPA of $21.43 hides a $3.33 channel and a $40.00 one.
- Judging a short window. A channel with a long consideration period looks bad in the first two weeks. Compare like for like against the same period earlier.
- Counting bots as visitors. Automated traffic inflates sessions and lowers conversion rate. Use a tool that separates it.
- Too many numbers, no decision. If a metric cannot lead to "spend more", "spend less" or "fix this page", remove it from the report. A marketing dashboard should be built around those decisions.
| If you see… | It usually means | Check next |
|---|---|---|
| Good blended ROAS, one channel far below the others | The average hides a losing channel | ROAS and gross profit after spend per channel, against 1 ÷ gross margin |
| Low cost per session, high cost per order | Cheap traffic that rarely buys | Conversion rate by channel and landing page |
| Platform reports more conversions than you have orders | Each platform claims its own conversions | Reconcile to your own order records |
| A channel looks weak, but cutting it lowers other channels | It assists rather than closes | First-touch and linear views next to last touch |
| Channel names split across tools | Inconsistent campaign tags | One spelling per source, medium and campaign |
Run these checks before you trust a trend; most surprises come from definitions, not from customers.
Marketing analytics in TapCub
Take the three-channel store above and rebuild it in TapCub. TapCub measures visits, conversions and the spend you give it; it does not buy ads, send email or bid for you, so every action in the example stays in your ad platforms and email tool.
- Tag the links and check the channels. With campaign parameters on your links, open Web analytics › Sources to see visitors by channel, source and UTM values. Channel rules can be configured, so check that paid search, paid social and email land in the right channels. Naming rules: sources and UTM.
- Bring in spend. Open All-platform analytics › Business › Channel ROI, go to Costs and add spend per row or import a CSV (
dayandcostare required;channel,source,campaign,currency,clicksandimpressionsare optional). Importing the same day, channel, source and campaign again overwrites the row. - Read the table. On the ROI tab, group by channel, source or campaign. TapCub shows cost per click (spend ÷ sessions), cost per acquisition (spend ÷ purchases on the order ledger) and return on ad spend (revenue ÷ spend), as in metrics 4, 5 and 7. Humans and bots are counted separately, so crawlers do not pad the sessions behind them. Margin (metric 8) is a step you do yourself: compare ROAS with 1 ÷ your gross margin.
- Compare credit models. Open All-platform analytics › Behavior › Behavior analysis, choose attribution, and select several models at once; each gets its own column, so a channel that only assists is visible. The default looks back 30 days (1–90) and includes the session of the conversion; touchpoints default to the channel. Position-based gives one touch everything, two touches half each, and more touches 40% to each end and 20% shared in the middle. This analysis allocates credit among sessions before the conversion; it is unrelated to the spend table.
- Mark what you changed. Add a note under Configuration › Annotations when you change a budget or launch a campaign, so a jump in the chart is explained next month.
FAQ
What is marketing analytics in simple terms?
Marketing analytics is collecting data about marketing activity, joining it to results such as orders and revenue, and using it to decide where to spend. Its core question is "where did the money go and what did it bring back?" It usually starts with channel, cost and conversion tracking.
What are the four types of marketing analytics?
Commonly they are descriptive (what happened), diagnostic (why), predictive (what will happen) and prescriptive (what to do). This guide stacks them the other way: measure, connect cost to outcome, assign credit, then predict and allocate.
What metrics should I track first?
Sessions by channel, conversion rate, spend, cost per session, cost per acquisition, revenue, return on ad spend and gross profit after spend. Eight metrics per channel and campaign answer whether each channel made money, which is the question most reports never reach.
How is marketing analytics different from web analytics?
Web analytics describes what visitors do on your site. Marketing analytics adds the other half: what each channel cost and which activity earned the visit. Without spend and campaign data you can describe traffic, but you cannot say whether any channel paid back.
How much data do I need before the numbers mean anything?
Enough orders per channel that one more order does not change the picture. With 100 orders a month, three or four orders shift a conversion rate noticeably. Compare periods of the same length, show the order counts beside the rates, and treat small channels as directional.
Sources
- Google Analytics Help, Get started with attribution (definition of attribution and the models offered).
- Google Analytics Help, Collect campaign data with custom URLs (utm_source, utm_medium, utm_campaign).
- Google Ads Help, About Target ROAS bidding (ROAS as conversion value per cost).
Was this article helpful?
We use your answers to fix and expand this page.
Couldn’t send. Please try again in a minute.
Thanks for the feedback. We’ll use it to improve this page.You’ve already sent feedback on this page. Thanks.

Product Adoption Consultant
Explores customer onboarding, live conversations, and self-service, turning common usage questions into practical guidance and improvements.