Try it on your own data
Every report in this article is in the free plan. One snippet for web and apps, up to 10 sites.
Start freeA marketing goal is a business result with a number, a baseline and a date, such as raising online revenue from $48,000 to $60,000 in 90 days. It only works if you can split it into levers (traffic, conversion, order value), give each lever to a channel and count it from an event that already fires. Below: tests, a worked split and how to read a missed checkpoint.
What you will learn
- Write every goal as a number, a baseline and a date, then name the channels expected to move it
- Split a revenue goal into sessions × conversion rate × order value so each lever needs a modest change
- Set monthly checkpoints and diagnose a miss by dividing each lever by its baseline
What is a marketing goal, and how is it different from a KPI?
A marketing goal is the business result you want marketing to produce by a date: more revenue, more qualified leads, more returning customers. A KPI is the metric you read to see whether you are getting there. A goal without a metric cannot be checked; a metric without a goal is just a number on a dashboard.
Three words get mixed up, so fix them first:
- Goal: the outcome and the date. "Raise monthly online revenue from $48,000 to $60,000 within 90 days."
- Target: the number you commit to for a metric. "Conversion rate 2.0% → 2.16%."
- KPI: the metric that carries the target, and the place it is counted. "Online conversion rate, from the store's order events."
Which metrics to track for each goal is covered in marketing KPIs; how goals cascade into team-level objectives is in OKR vs KPI. This guide covers the step before both: turning a wish into a goal that is quantified, attached to channels and bounded in time.
Which marketing goals are worth setting, and what does each one measure?
Most marketing goals fall into five families. Pick the one that matches the stage of the business, not all five at once.
| Goal family | Typical wording | Metric that carries it | Where it is counted |
|---|---|---|---|
| Awareness | Reach more of the right people | Unique visitors from new sources | Web analytics, by source |
| Traffic | Grow visits from a channel | Sessions per channel | Web analytics, by channel |
| Leads | Collect more enquiries | Goal conversions and conversion rate | A form-submit event or thank-you page |
| Revenue | Sell more online | Orders, revenue, average order value | Purchase events |
| Retention | Bring buyers back | Returning-user rate, repeat purchase rate | Retention or cohort report |
Two things to notice. First, every row names a place where the number is already counted; a goal with no such place is a hope. Second, the families stack: revenue = traffic × conversion rate × average order value. That identity is what makes the next section possible.
How do you turn "grow the business" into a measurable goal?
Sample data: an online store earned $48,000 last month. It wants $60,000 a month within 90 days. Write the arithmetic out before choosing tactics.
Baseline (last month)
- Sessions: 40,000
- Conversion rate: 2.0%, so orders = 40,000 × 2.0% = 800
- Average order value: $60
- Revenue: 800 × $60 = $48,000
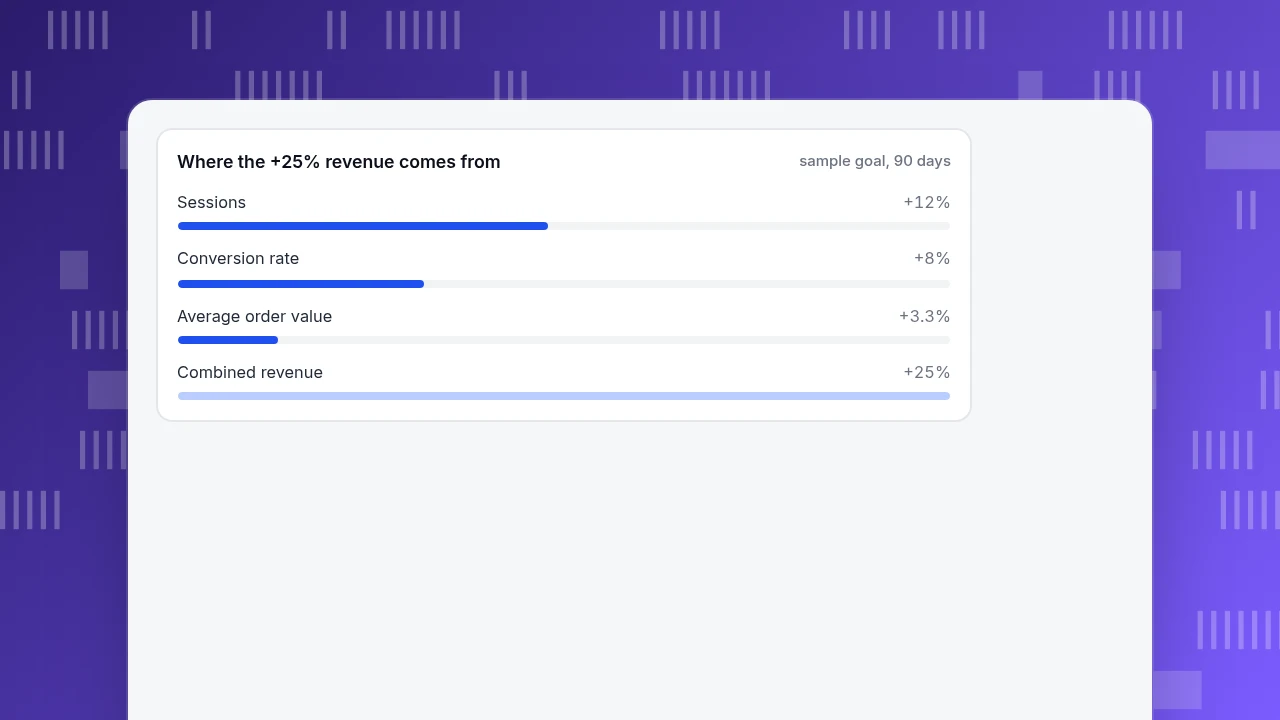
Required lift. $60,000 ÷ $48,000 = 1.25, so revenue must grow 25%. Because revenue is three numbers multiplied, the 25% can be split across them:
| Lever | Baseline | Target | Change |
|---|---|---|---|
| Sessions | 40,000 | 44,800 | +12% |
| Conversion rate | 2.00% | 2.16% | +8% |
| Average order value | $60 | $62 | +3.3% |
Check: 44,800 × 2.16% = 967.68 orders; 967.68 × $62 = $59,996, which rounds to the $60,000 goal. Notice how modest each lever is. A single lever would have to carry the whole 25%, which is usually unrealistic: sessions alone would need 50,000 visits, or conversion alone 2.5%.
Attach channels. The 4,800 extra sessions need owners. Baseline sessions were organic 16,000, paid 8,000, email 4,000, direct 8,000, social and referral 4,000.
| Channel | Baseline sessions | Extra sessions | Why |
|---|---|---|---|
| Organic | 16,000 | +3,000 | Content already ranks; expand it |
| 4,000 | +1,000 | List growth plus one more send a month | |
| Paid | 8,000 | +800 | Small, capped by spend |
| Direct, social, referral | 12,000 | 0 | No planned work, so no target |
| Total | 40,000 | +4,800 | 44,800 sessions |
Set checkpoints. A 90-day goal reviewed once, at day 90, is a goal you find out about too late. Ramp it: $52,000 in month 1, $56,000 in month 2, $60,000 in month 3. If month 1 lands at $49,000, you know by day 30 that something needs changing.
Where the +25% revenue comes from
sample goal, 90 daysWhat should every marketing goal pass before you commit to it?
SMART (specific, measurable, achievable, relevant, time-bound) is a fair checklist, but it is vague about measurable. Use these five tests, which can each be answered yes or no:
- Has a number. "More leads" fails; "180 form submissions a month" passes.
- Has a baseline. The number only means something against last month or last quarter. If the baseline is unknown, the first goal is to measure it.
- Has an owner channel. Someone can name the channels expected to move it. In the example above, the 4,800 extra sessions are split by channel.
- Has a date. A deadline and at least one checkpoint before it.
- Has a data source already collecting it. The event or page that counts the goal exists and fires today. In Google Analytics, for instance, a key event is any collected event you mark as important, so the event must exist before it can be marked.
If a goal fails any test, rewrite it before the quarter starts, not in the review meeting.
| Weak goal | Fails which test | Rewritten goal |
|---|---|---|
| Get more leads | No number, no date | 180 qualified form submissions a month by the end of the quarter |
| Publish 20 posts | Counts activity, not a result | Add 3,000 organic sessions a month from the blog in 90 days |
| Grow revenue | No lever split, no channel owner | Revenue $48,000 → $60,000 a month: sessions +12%, conversion +8%, order value +3.3% |
| Improve conversion | No baseline | Raise conversion from 2.00% to 2.16% on product pages by day 90 |
| Be everywhere | No data source, no owner | Cut the goal to three channels with one counted event each |
Sample data. Each rewrite names a number, a baseline or lever, a channel and a date.
How do you set marketing goals, step by step?
- Start from one business number. Revenue, qualified leads, or active customers. Not a marketing metric.
- Pull the last 90 days of baseline for every part of the equation (sessions, conversion rate, order value) by channel.
- Size the gap as a multiple, as in 60,000 ÷ 48,000 = 1.25, so you can compare it with what the channels have done before.
- Split the gap across levers, then across channels, using past growth as a ceiling. If organic traffic grew 5% a month for a year, +15.8% in a quarter (1.05³ − 1) is plausible; +60% is a bet that needs a reason.
- Define each counted event and check it with a test conversion.
- Schedule checkpoints monthly, and write down in advance what result would make you change the plan.
How do you read a checkpoint when revenue is behind the ramp?
Sample data: at day 30 the store's sessions are 41,000, conversion rate 2.05% and average order value $60. Orders = 41,000 × 2.05% = 840.5, and revenue = 840.5 × $60 = $50,430, against a ramp of $52,000. That is $1,570 short, or 3.0%.
Do not stop at "behind". Divide each lever by its baseline: sessions 41,000 ÷ 40,000 = 1.025, conversion 2.05% ÷ 2.00% = 1.025, order value $60 ÷ $60 = 1.000. Multiply: 1.025 × 1.025 × 1.000 = 1.0506, and $48,000 × 1.0506 = $50,430, so the lever split explains the revenue exactly. The ramp needed about 1.08 (one third of each lever's target: sessions +4%, conversion +2.7%, order value +1.1%), so the gap sits mostly in sessions (+2.5% against +4%) and order value (flat against +1.1%), while conversion is close to plan. The next step is then a traffic and basket-size question, not a checkout fix.
Which mistakes make marketing goals unusable?
- Goals measured by activity. "Publish 20 posts" is a task. The goal is what the posts should produce, such as +3,000 organic sessions.
- One number, no breakdown. "+25% revenue" with no lever split gives nobody anything to do on Monday.
- A target above what the channel can absorb. Doubling paid sessions with the same budget means doubling the cost per session or finding new audiences.
- A goal counted two ways. If the ad platform reports 1,000 leads and your analytics shows 700, pick one source before the quarter starts; otherwise the review is an argument about definitions.
- Moving the goal after seeing the data. If you change it, record the change and the reason; otherwise you can never tell whether the plan worked.
- Counting bots as visitors. Crawler traffic inflates sessions and drags the conversion rate down, so the lever split in the example would be wrong from the start.
How do you track marketing goals in TapCub?
Here is how the store above would set up the 90-day goal. TapCub counts and compares; it does not set targets or run campaigns.
- Define the goal. In Web analytics › Goals, create a goal as an event (such as the purchase event) or a page (the thank-you path). Turn on revenue tracking and name the revenue property if you want revenue on the card. The same goals appear under All-platform analytics › Business › Goals. The conversion rate divides by unique visitors in the period, not by sessions, so use the same denominator when you set the target.
- Read the channel split. Web analytics › Sources shows visitors by channel and UTM parameters. Compare each channel with the +3,000 / +1,000 / +800 extra sessions in your plan. Crawlers and AI bots are counted separately in Web analytics › Bots, so they do not inflate the sessions you are trying to grow.
- Add cost. In All-platform analytics › Business › Channel ROI, import spend by day, channel and campaign. TapCub then shows cost per click (spend ÷ sessions), cost per acquisition (spend ÷ purchases on the order ledger) and return on ad spend.
- Review monthly. Compare each checkpoint with $52,000 / $56,000 / $60,000. A monitor in All-platform analytics › Operations › Monitors can notify you when a metric crosses a threshold, but it only notifies; changing the plan is your call.
FAQ
What are examples of marketing goals?
Increase monthly online revenue from $48,000 to $60,000 in 90 days; collect 180 qualified form submissions a month by the end of the quarter; raise the 7-day return rate of new buyers from 13% to 16%. Each names a number, a baseline and a date, and each can be counted from an event that already exists.
What is the difference between marketing goals and marketing objectives?
Sources use the words loosely. A practical split: a goal is the outcome you want (higher revenue), and an objective or target is the specific number and date that defines success (+25% in 90 days). If your team uses the words differently, keep the rule that every goal ends in a number and a date.
How many marketing goals should a team have?
One primary goal per quarter and at most two supporting ones. Every goal needs channel owners and a checkpoint, and each additional goal splits the attention available. If two goals pull in opposite directions, such as maximum traffic and lowest cost per lead, rank them.
How often should you review marketing goals?
Check progress monthly against the ramp you set, and revisit the goal itself once a quarter. Weekly numbers for small channels bounce too much to act on; with a few hundred conversions a month, one week can swing by double digits on chance alone.
Can a goal be revenue when marketing does not control pricing or product?
Yes, if you split it into the parts marketing influences. In the example, marketing owns sessions and most of conversion rate; average order value needs product or pricing input, so give it a smaller share or make it a shared target.
Sources
- Google. About key events. Analytics Help. Any collected event can be marked as a key event and reported with the touchpoints that led to it. Checked 2026-11-19.
- Google. About channel groups. Analytics Help. How traffic is grouped into channels for reporting. Checked 2026-11-19.
Was this article helpful?
We use your answers to fix and expand this page.
Couldn’t send. Please try again in a minute.
Thanks for the feedback. We’ll use it to improve this page.You’ve already sent feedback on this page. Thanks.

Product Experience Specialist
Explores usability, user journeys, and feature adoption through practical examples of onboarding and everyday product use.