Try it on your own data
Every report in this article is in the free plan. One snippet for web and apps, up to 10 sites.
Start freeMarketing optimization is moving budget from channels that return less to channels that return more, and it only works when the counting rules stay stable. Compare channels on two attribution models, use marginal return for the channel you would add to, move 10% to 20% at a time and test the move. Below: a recomputed example, written rules and what the research says.
What you will learn
- Lock the conversion, window and attribution rule first; an unstable measure turns winners into artifacts
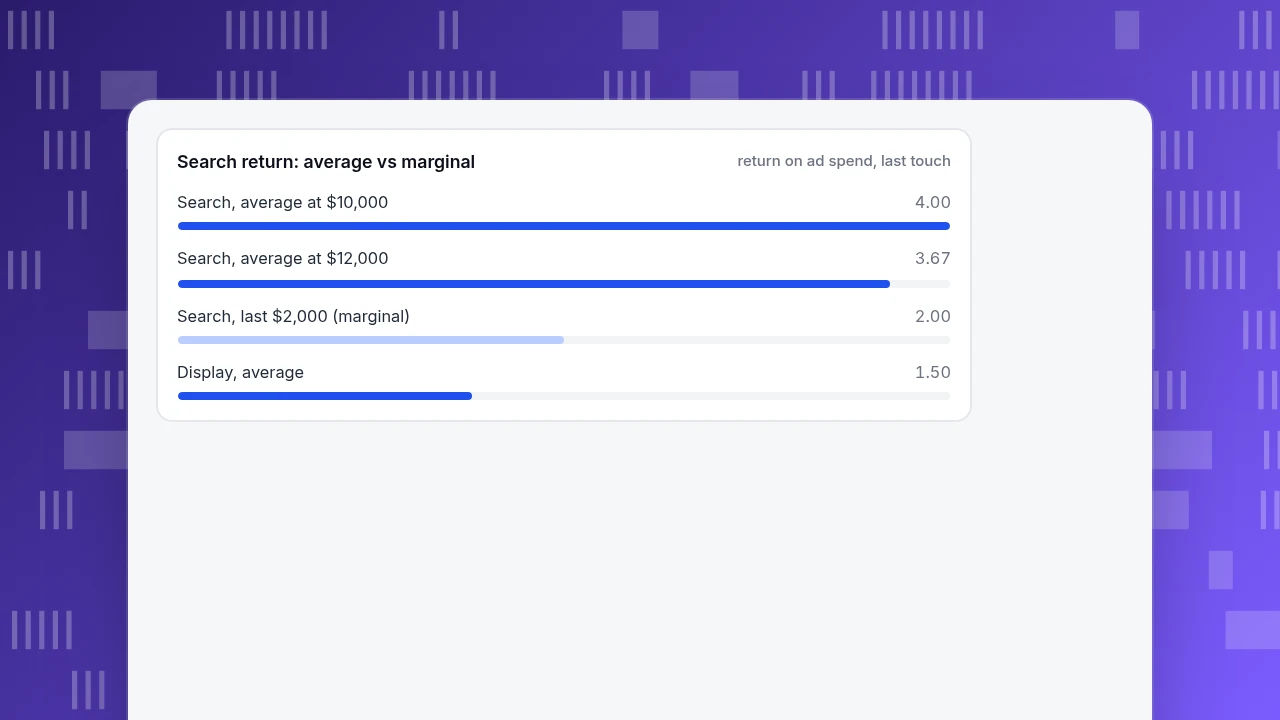
- Use marginal return for the next dollar: search averaged 3.67 but its last $2,000 returned 2.00
- Move 10% to 20% of a channel's budget by written rules, then test in a split region before committing
What is marketing optimization, and how is it different from tuning one campaign?
Marketing optimization is the work of moving effort and budget from channels that return less to channels that return more, using measurement you trust. The unit is the portfolio: search, social, email, display, content. Tuning a single campaign (a headline, a bid, an audience) is covered in campaign optimization; this guide is about the decision above it: where the next dollar goes.
That decision rests on one assumption, so state it up front: a channel's reported return must mean the same thing this month as last month, and across channels. If the counting rules move, an apparent winner can be an artifact. Fixing that comes before moving any money. For the return metric itself, see marketing ROI.
The process is five steps, each of which gets a section below:
- Lock the measurement rules.
- Compare channels on the same basis.
- Separate average return from marginal return.
- Move a small slice by rule, not by feeling.
- Test the move before committing.
Why do you lock the measurement before moving money?
Channel return depends on how credit is assigned. The same sales can make a channel look strong or weak depending on the attribution model. Three things must be held constant:
- The conversion. Purchases, not "any goal"; one definition of revenue (before or after refunds).
- The window. The same date range, long enough to cover your conversion lag. If buyers typically take 10 days to purchase, a 7-day window undercounts every channel, slow ones the most.
- The attribution rule. One model for the main comparison, a second as a check.
Sample data shows why the second model matters. Four channels, 30 days, $26,000 spent and $70,000 of revenue in total under both models:
| Channel | Spend | Revenue, last touch | ROAS, last touch | Revenue, linear | ROAS, linear |
|---|---|---|---|---|---|
| Search | $10,000 | $40,000 | 4.00 | $31,000 | 3.10 |
| Social | $8,000 | $12,000 | 1.50 | $18,000 | 2.25 |
| Display | $6,000 | $9,000 | 1.50 | $12,000 | 2.00 |
| $2,000 | $9,000 | 4.50 | $9,000 | 4.50 | |
| Total | $26,000 | $70,000 | 2.69 | $70,000 | 2.69 |
ROAS (return on ad spend) is revenue ÷ spend. Check one: Search under last touch is $40,000 ÷ $10,000 = 4.00; under linear it is $31,000 ÷ $10,000 = 3.10. The total is the same; only the split moves. Social and display look equal under last touch (both 1.50), but social is clearly ahead under linear (2.25 against 2.00) because it often introduces people who another channel later closes.
What both models agree on is the safe part of the story: email and search return more than social and display, and the ranking of those two groups does not change. What they disagree on, social against display, is not a basis for moving money.
What does a worked reallocation look like?
Using the table above, the store considers moving $2,000 of display spend to search. That is $2,000 ÷ $26,000 = 7.7% of the budget.
The case for it: under last touch, display returns 1.50 and search 4.00. If you spent each additional dollar at the average, the move would add $2,000 × 4.00 = $8,000 of revenue and lose $2,000 × 1.50 = $3,000, a net +$5,000. But average return is the wrong number for an additional dollar, which is the next section's point. With a marginal figure for search the picture changes.
Why must you use marginal return, not average return?
Average return is total revenue ÷ total spend. Marginal return is the extra revenue from the extra dollar. Channels have diminishing returns: the first dollars reach the people most likely to buy; later dollars reach people less likely to.
Sample data: the store raised search spend from $10,000 to $12,000 and, with everything else steady, search revenue under last touch rose from $40,000 to $44,000.
- Average return: $44,000 ÷ $12,000 = 3.67.
- Marginal return: ($44,000 − $40,000) ÷ ($12,000 − $10,000) = 2.00.
Search's last dollars return 2.00, half of its 4.00 average. The reallocation is now: gain $2,000 × 2.00 = $4,000 in search; lose at most $2,000 × 1.50 = $3,000 in display (display's marginal return is probably at or below its average, so the loss is at most that). Net: at least +$1,000 under last touch, not +$5,000.
Under linear attribution, display's average is 2.00. If search's marginal return were also about 2.00 on that basis, the gain would be zero. This is why the second model matters: the move is probably positive, not certainly. So make a small move and test it.
Search return: average vs marginal
return on ad spend, last touchWhat rules should decide when to shift budget?
Write the rules down before looking at the numbers, so they cannot bend to what you hope to see.
- Compare on two models. Move money from channel A to B only if B's return is higher under both, or if B is higher under the model you trust and not lower under the other.
- Use marginal, not average, for the receiving channel. Measure the return from the last increase, not the whole channel.
- Need enough conversions. At least 100 conversions per channel in the window. Below that, a few orders swing the ratio. With 20 conversions a month, one extra order is a 5% change.
- Cap the shift. Move 10% to 20% of a channel's budget at a time, as the 7.7% above. Large moves make it impossible to tell which change did what.
- Do not starve what it feeds. Channels that start journeys (social, display) can look poor under last touch yet supply the people search and email later convert. Cut them in steps and watch the others.
- Set a review date. Two full conversion cycles. Reverse the move if the combined return does not improve.
- Leave small channels alone. Email returns 4.50, but the budget is $2,000 and the bottleneck is list size, not spend. More money will not raise it.
| Rule | Threshold | In the sample |
|---|---|---|
| Models agree | Receiving channel higher under both models | Search and email beat social and display under both; social vs display is a tie to test |
| Marginal return | Measure the last increase, not the average | Search: average 3.67, marginal 2.00 |
| Enough conversions | At least 100 per channel in the window | 20 a month: one order moves the ratio 5% |
| Cap the move | 10% to 20% of a channel's budget | $2,000 = 7.7% of the $26,000 total |
| Review date | Two full conversion cycles | Reverse if combined return does not rise |
Sample data. Write the rules before you look at the numbers.
How do you test a shift before committing?
Reported returns come from observational data: people who saw an ad are not a random sample, because ads are aimed at people already likely to buy. The two best-known experiments show how large the gap can be.
- Search ads at an online marketplace. Blake, Nosko and Tadelis ran field experiments and found that paid search returns were only a fraction of non-experimental estimates, because search clicks and purchase intent are correlated. Ads on the company's own brand keywords showed no measurable short-term benefit.
- Advertising at a social network. Gordon and colleagues compared 15 randomized advertising experiments with common observational methods and found that the observational models often missed the experimental effect, even with extensive controls.
The lesson is not that measurement is useless; it is that a spreadsheet shows correlation. A practical test for a budget move:
- Pick two similar regions or audiences, move the budget in one and leave the other unchanged.
- Run for at least two conversion cycles.
- Compare total sales, not just the channel's reported conversions. If you moved $2,000 into search and total revenue did not rise, the reported gain was reassignment, not growth.
- Keep a pause group for channels you suspect add little, such as brand terms people would have searched anyway.
Which mistakes derail marketing optimization?
- Optimizing to a number that moves. Changing the window or attribution model mid-quarter makes any before-and-after comparison meaningless.
- Cutting the top of the funnel because last touch gives it little credit. Check linear or position-based credit first.
- Moving too much at once. A 40% shift cannot be attributed to anything.
- Treating averages as increments. Average 4.00 and marginal 2.00 are different decisions.
- Counting bot traffic. Crawler visits inflate sessions and deflate conversion rates, which skews cost per click and the whole ranking.
- Optimizing revenue when margin differs by channel. A 3.00 ROAS on a low-margin product line can lose money.
How do you do this in TapCub?
TapCub supplies the measurement; moving the money happens in your ad accounts. TapCub does not set budgets, change bids or run campaigns, and it is not an experiment tool.
- Put cost beside results. In All-platform analytics › Business › Channel ROI, add spend by day, channel, source and campaign (one row at a time or by CSV). The page shows cost per click (spend ÷ sessions), cost per acquisition (spend ÷ purchases on the order ledger) and return on ad spend, grouped by channel, source or campaign.
- Compare models side by side. In All-platform analytics › Behavior › Behavior analysis, select attribution and choose several models at once (first touch, last touch, linear, position-based, time decay). Each gets its own column, so a channel that only assists shows up at once. The touchpoint is channel by default, and the lookback window defaults to 30 days; keep both the same across periods.
- Keep bots out of the ratio. Crawlers and AI bots are counted in Web analytics › Bots, not in your visitor and conversion numbers.
- Watch the move. Add an annotation under Configuration › Annotations on the day you shift budget, and review the two cycles afterward. A monitor in All-platform analytics › Operations › Monitors can alert you if a metric breaks a threshold; it only sends a notification.
Attribution in TapCub assigns credit using the sessions before a conversion; it is not install attribution and it does not run randomized tests.
FAQ
What does marketing optimization mean?
It means improving marketing results by shifting effort and budget toward what returns more, based on data you trust. At the portfolio level that is a budget decision between channels; at the campaign level it is tuning creative, targeting and bids. This guide covers the first, using marginal return and two attribution models.
How do you optimize marketing spend?
Lock the conversion, window and attribution rule; compare channels on two models; measure marginal return for the channel you would add to; move 10% to 20% at a time; and test the move in a split region or audience before committing. Review after two full conversion cycles.
What is the difference between average and marginal return?
Average return is total revenue divided by total spend. Marginal return is the extra revenue from the last extra dollar. In the sample, search averaged 3.67 but its last $2,000 returned 2.00. Budget decisions use the marginal figure because they concern the next dollar, not the past ones.
How much budget should you move at once?
Ten to twenty percent of a channel's budget is a common cautious range. The reason is attribution: when you move 40% at once you cannot say which change drove the result. The sample moves 7.7% of the total budget, which can be reversed cheaply if it does not work.
Which attribution model should you use for budget decisions?
Use one as the main model and a second as a check, and act only where they agree on direction. Last touch rewards channels that close; linear and position-based give credit to channels that open and assist. If they disagree on a channel, test rather than guess.
Sources
- Thomas Blake, Chris Nosko & Steven Tadelis. Consumer Heterogeneity and Paid Search Effectiveness: A Large Scale Field Experiment. NBER Working Paper 20171, published in Econometrica 83(1), 2015 — returns from paid search are a fraction of non-experimental estimates; no measurable short-term benefit on brand keywords. Checked 2026-11-19.
- Brett R. Gordon, Florian Zettelmeyer, Neha Bhargava & Dan Chapsky. A Comparison of Approaches to Advertising Measurement: Evidence from Big Field Experiments at Facebook. Marketing Science 38(2), 2019 — 15 randomized experiments compared with observational methods. Checked 2026-11-19.
Was this article helpful?
We use your answers to fix and expand this page.
Couldn’t send. Please try again in a minute.
Thanks for the feedback. We’ll use it to improve this page.You’ve already sent feedback on this page. Thanks.

Product Adoption Consultant
Explores customer onboarding, live conversations, and self-service, turning common usage questions into practical guidance and improvements.