Try it on your own data
Every report in this article is in the free plan. One snippet for web and apps, up to 10 sites.
Start freeMarketing technology solutions are best organised by data flow, not by vendor. Almost every tool does one of four jobs: capture, store and identify, activate or measure. List each tool's job, data and cost, draw the arrows that really carry data and count arrows, not tools, as the cost. Below: a nine-tool audit and a scorecard.
What you will learn
- Map by data flow: each tool's job, data in, data out, owner and cost; arrows are the real cost
- Draw only flows that exist today, and automate the manual ones first
- Choose with a weighted scorecard that includes data export and privacy, not just features
What are marketing technology solutions?
Marketing technology solutions are the software a team uses to reach people, learn from what they do and manage the relationship: analytics, email, a CRM, advertising accounts, chat, surveys, content tools and the connections between them. The set you run is your stack. The word covers everything from one script on a website to an enterprise platform.
The market is large. Scott Brinker's 2025 Marketing Technology Landscape counts 15,384 solutions in 49 categories, up 9% from 14,106 the year before. Nobody needs more than a sliver of that, so a vendor list is a poor starting point. A better one is a short list of jobs. Almost every tool in a stack does one of four:
| Job | The question | Examples of what lives here |
|---|---|---|
| Capture | Who arrived and what did they do? | Analytics, tags, forms, chat |
| Store and identify | Who is this person or account? | CRM, customer database, data warehouse |
| Activate | How do we reach them? | Email, ads, messaging, content |
| Measure | Did it work? | Reporting, attribution, experiments, surveys |
The thesis of this guide: map your marketing technology by data flow, not by vendor. A vendor list tells you what you bought; a flow map tells you what each tool needs, what it produces and where it can break. Product choices across the market are covered in SaaS tools, the term itself in the martech glossary entry and the methods for connecting systems in data integration approaches. This guide is about laying them out as one picture.
| Job | The question | Examples |
|---|---|---|
| Capture | Who arrived and what did they do? | Analytics, tags, forms, chat |
| Store and identify | Who is this person or account? | CRM, database, warehouse |
| Activate | How do we reach them? | Email, ads, messaging |
| Measure | Did it work? | Reporting, attribution, surveys |
The 2025 landscape lists 15,384 solutions in 49 categories; start from jobs, not vendors.
Why map by data flow?
A stack that grows by vendor grows by accident: a team needed email, another needed a survey, a third wanted heatmaps, and each tool arrived with its own copy of the customer. Problems show up as symptoms: two numbers for the same metric, a customer who gets the same email twice, a report that takes a day to assemble.
A flow map asks six questions about each piece of data:
| Stage | The question | What goes wrong |
|---|---|---|
| Collect | Where is it first recorded? | Two tools record the same event differently |
| Identify | What links it to a person or account? | No shared ID, so records cannot be joined |
| Store | Where is the source of truth? | Several tools each hold a different version |
| Decide | Which rule picks the audience or the message? | The rule lives in one tool and is invisible to others |
| Activate | Which tool sends or shows it? | Two tools reach the same person |
| Measure | How do we know it worked? | Credit is counted twice, or not at all |
Every arrow on the map is a connection someone must build and maintain, which is why the number of arrows is the real cost of a stack, more than the number of tools.
How do you map your stack in an hour?
- List every tool that touches customer data or campaign results, including free ones and the ones one team uses.
- For each tool, record: its job from the four above, the data it creates, the data it needs, who owns it, the monthly cost and whether it holds personal data.
- Draw the arrows that actually carry data today, and mark each one as automatic, scheduled or a manual copy of a file.
- Circle three things: jobs done by more than one tool, tools with no arrows in or out, and manual arrows.
- Name a source of truth for each entity: customer, account, order, campaign.
Do not draw arrows you would like to have. A map of real flows shows the problem; a map of intentions hides it.
What does a stack audit show in numbers?
Sample data: a small team lists nine tools.
| Tool | Job | Monthly cost |
|---|---|---|
| Website analytics | Measure | $300 |
| Product analytics | Measure | $600 |
| Heatmap tool | Measure | $150 |
| Ad reporting connector | Measure | $250 |
| Survey tool | Measure | $40 |
| CRM | Store and identify | $800 |
| Email platform | Activate | $400 |
| Newsletter tool | Activate | $120 |
| Chat | Capture | $80 |
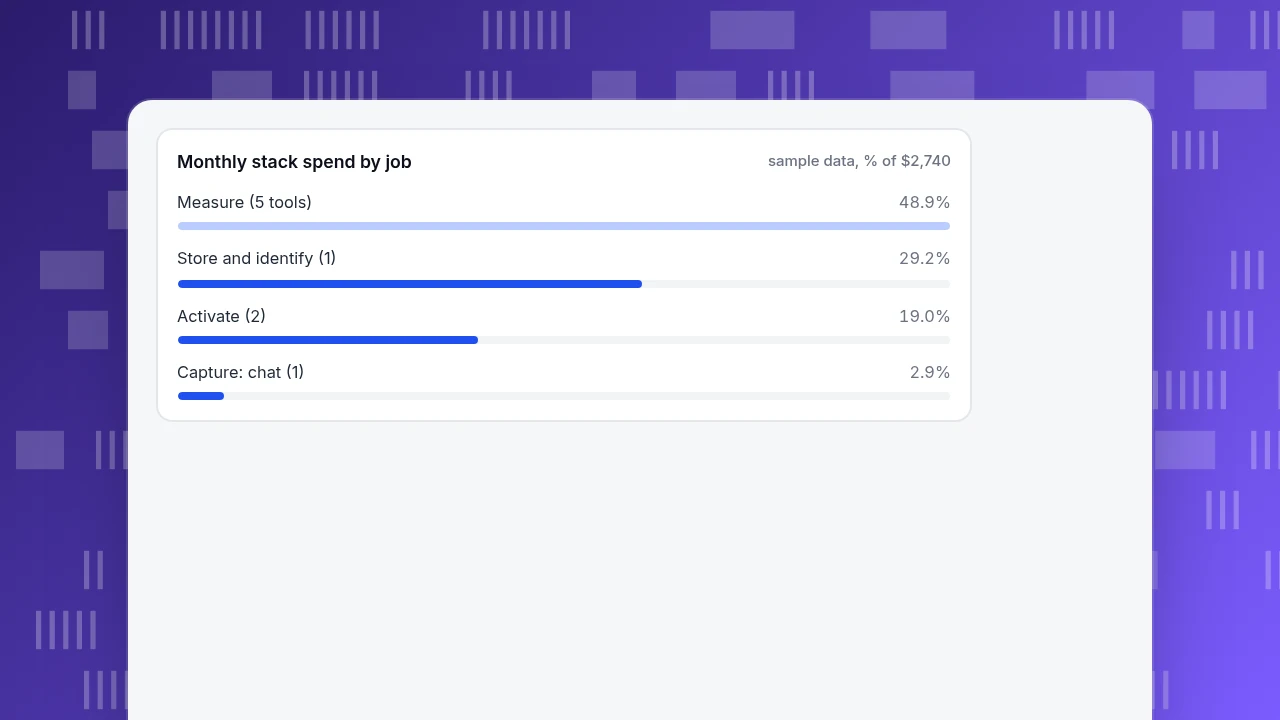
The total is 300 + 600 + 150 + 250 + 40 + 800 + 400 + 120 + 80 = $2,740 a month. Grouped by job: measure is 300 + 600 + 150 + 250 + 40 = $1,340 (48.9%); store and identify $800 (29.2%); activate 400 + 120 = $520 (19.0%); chat $80 (2.9%). Almost half of the spend is on measuring, spread across five tools.
Now the connections. Nine tools can in theory be paired in 9 × 8 ÷ 2 = 36 ways. The map shows that only 11 flows actually carry data, and four of them are a person exporting a file and uploading it somewhere else. Those four are where numbers drift. Two findings follow: two tools do the activate job for email ($520 together), and several measure tools overlap. If the newsletter tool is retired into the email platform, saving $120 a month ($1,440 a year, 4.4%), and the heatmap job can be done inside one of the analytics tools already paid for, saving $150 more, the total saving is $270 a month, 9.9%. The more valuable result is not the saving but the four manual arrows, which are the first to automate. The tools and prices are sample data.
Monthly stack spend by job
sample data, % of $2,740How do you choose a solution for a gap?
Write the job and the data first, then score candidates against the same criteria. A weighted scorecard keeps the decision about the flow rather than the demo:
| Criterion | Weight | What to check |
|---|---|---|
| Job fit | 30 | Does it do the job you wrote down? |
| Data access and export | 25 | Can you get your data out, in bulk, when you leave? |
| Integrations | 20 | Native connection, API or file only? |
| Privacy and contracts | 15 | Is there a processor agreement, and where is data held? |
| Cost at your volume | 10 | Price at your traffic or contacts, not the entry plan |
Sample data: candidate X scores 4, 5, 3, 4 and 3 out of 5 on the five criteria; candidate Y scores 5, 2, 4, 3 and 4. X: 4 × 30 + 5 × 25 + 3 × 20 + 4 × 15 + 3 × 10 = 395, or 79 out of 100 (395 ÷ 5). Y: 5 × 30 + 2 × 25 + 4 × 20 + 3 × 15 + 4 × 10 = 365, or 73. Y fits the job slightly better but is hard to leave, so X wins. The weights are yours to set.
If a tool processes personal data for you, privacy law usually requires a contract. Under the GDPR, Article 28(3) says processing by a processor must be governed by a binding contract that sets out the subject and duration of the processing, its nature and purpose, the types of personal data and the controller's obligations; this is not legal advice, so ask your counsel about your own case.
What rules keep a stack healthy?
- One identifier per entity. Pick the customer ID and use it everywhere; tools that cannot store it are hard to join.
- Define each event once. One name, one meaning, written in a place everyone can see.
- One writer per field. If two tools can update the same field, they will overwrite each other.
- Decide where consent lives and make sure it travels with the data.
- Test the exit. Export your data from every tool once a year, before you need to.
- Review the map twice a year. Stacks drift.
What goes wrong with marketing technology?
- Buying to a vendor category list. Start from the job.
- Counting tools instead of connections. Arrows are the cost.
- Manual arrows left in place. Each export is a place numbers drift.
- No source of truth. Every report disagrees.
- Adding a tool to fix a process. If two teams define a customer differently, software will not decide.
- Forgetting exit and privacy. You find out when you try to leave.
Where does TapCub fit on the map, and what does it connect to?
Take the capture and measure parts of the audit. TapCub sits there, together with live chat. It is not a CRM, an email platform or an ad system; what it offers is a clean place to measure and ways to get data in and out:
- Capture in one place. One script on the website, plus SDKs for iOS, Android, Flutter, React Native and HarmonyOS and for mini programs, send web, app and mini-program data to one project with the same events and user model. Live chat uses the same visitor ID.
- Define events once. In All-platform analytics › Data › Tracking plan, record each event with display name, category, platform, trigger, properties, owner and status; turn on live validation (last 24 hours) to see arrivals and how complete the required properties are.
- Share the identifier. Call
tapcub.loginwith your customer ID after sign-in so people appear in All-platform analytics › Users › People under the same ID your CRM uses, andtapcub.group('company', 'acme', {...})for accounts. - Bring data in. The server HTTP API sends events from your back end, and All-platform analytics › Data › Data import takes CSV events, CSV user properties and Nginx or Apache logs, up to 100,000 rows per file. TapCub does not import GA4 history one to one.
- Take data out. All-platform analytics › Data › Data export makes asynchronous exports of raw detail; your own AI agent can read analytics data through MCP, read-only. Credentials live in Configuration › Settings › API keys.
- Route alerts. Monitors in All-platform analytics › Operations › Monitors notify through email, WeCom, DingTalk, Feishu or a webhook (with a Slack template). They only notify.
FAQ
What are marketing technology solutions?
They are the software marketing teams use to capture data about people, store and identify them, reach them and measure results: analytics, a CRM, email, ad accounts, chat, surveys and the connections between them. The combination a team runs is called its marketing technology stack.
How many marketing tools does a team need?
There is no number. Count jobs and connections, not tools: capture, store and identify, activate and measure, with one source of truth per entity. In the sample, nine tools had 11 real data flows, four of them manual, and two tools doing one job.
How do you build a martech stack?
List the jobs, choose one tool per job against a weighted scorecard (job fit, data export, integrations, privacy, cost at your volume), draw the data flows, name a source of truth for each entity and automate the manual arrows first. Review the map twice a year.
How do you audit your marketing technology?
List every tool with its job, cost, owner and data; draw the arrows that actually carry data; circle duplicated jobs, unconnected tools and manual arrows; then retire overlaps and automate manual flows. The audit's most useful output is usually the manual arrows, not the savings.
What is the difference between a martech stack and a marketing suite?
A suite is one vendor's bundle covering several jobs; a stack is the set of tools a team actually runs, from one or many vendors. Either can be mapped the same way. What matters is whether data flows between the parts and where the source of truth sits.
Sources
- Scott Brinker, chiefmartec. 2025 Marketing Technology Landscape Supergraphic: 15,384 solutions in 49 categories, up 9% from 14,106. Verified 2026-11-19.
- European Union. General Data Protection Regulation, Article 28: Processor: paragraph 3 on the contract governing processing. Verified 2026-11-19.
Was this article helpful?
We use your answers to fix and expand this page.
Couldn’t send. Please try again in a minute.
Thanks for the feedback. We’ll use it to improve this page.You’ve already sent feedback on this page. Thanks.

Product Adoption Consultant
Explores customer onboarding, live conversations, and self-service, turning common usage questions into practical guidance and improvements.