Try it on your own data
Every report in this article is in the free plan. One snippet for web and apps, up to 10 sites.
Start freeSaaS tools are applications you rent and use over the internet. A good stack is built by function, not by category list: name the decision each tool supports, give it an owner, and cut overlap and idle seats. Below: eight functions, a 14-tool sample audit that saves 11.9%, a buying checklist and a safe way to retire a tool.
What you will learn
- Choose the function first, then the tool; if you cannot name the decision a tool supports, you do not need it yet
- The real cost is subscription plus idle seats plus admin time: $420 against a $300 sticker price in the sample
- Audit quarterly for overlap and idle seats; run old and new tools in parallel before cancelling
What are SaaS tools?
SaaS tools are applications you rent and use over the internet, instead of installing and running them yourself. The US National Institute of Standards and Technology defines software as a service as using the provider's applications running on a cloud infrastructure, reached through a web browser or a program interface, where the customer does not manage or control the underlying infrastructure. In everyday use, "SaaS tools" means the pile of subscriptions a company runs on: analytics, chat, CRM, billing, documents, code hosting and so on.
That definition hides the real problem. Each tool is cheap to start and easy to add, so stacks grow by accident: one tool for each request, with no one deciding what the whole set is for. This guide gives you a way to build the stack on purpose. It is for teams of roughly 5 to 50 people. For the broader idea see tech stack, and for the numbers a SaaS business tracks see SaaS metrics.
How do you group SaaS tools by function?
Group by the job a tool does for the business, not by category lists on review sites. Eight functions cover most companies:
| Function | The decision it supports | Data it holds |
|---|---|---|
| Growth and marketing | Where to spend to get visitors and leads | Campaigns, sources, spend |
| Product and analytics | What to build and fix next | Events, funnels, retention |
| Customer support | How fast and how well customers get answers | Conversations, tickets, satisfaction |
| Sales | Which deals to chase | Contacts, deals, pipeline stages |
| Finance and billing | Cash, pricing and renewals | Invoices, subscriptions, revenue |
| Collaboration | How the team plans and communicates | Messages, documents, tasks |
| Engineering | How software is built, shipped and kept running | Code, builds, errors |
| Security and IT | Who can access what | Identities, devices, access logs |
If you cannot name the decision a tool supports, you do not need the tool yet. If two tools support the same decision, one of them is probably redundant. Select the function first, then the tool.
What does a lean SaaS stack look like?
A starting point depends on stage, so treat the table as a sample, not a rule. It shows the tool count and typical decisions per stage.
| Stage | Functions to cover first | Rough tool count |
|---|---|---|
| Before launch | Collaboration, engineering, finance and billing, product analytics | 5 to 7 |
| First customers | Add customer support and growth tracking | 8 to 10 |
| Repeatable sales | Add sales pipeline and security and IT | 11 to 14 |
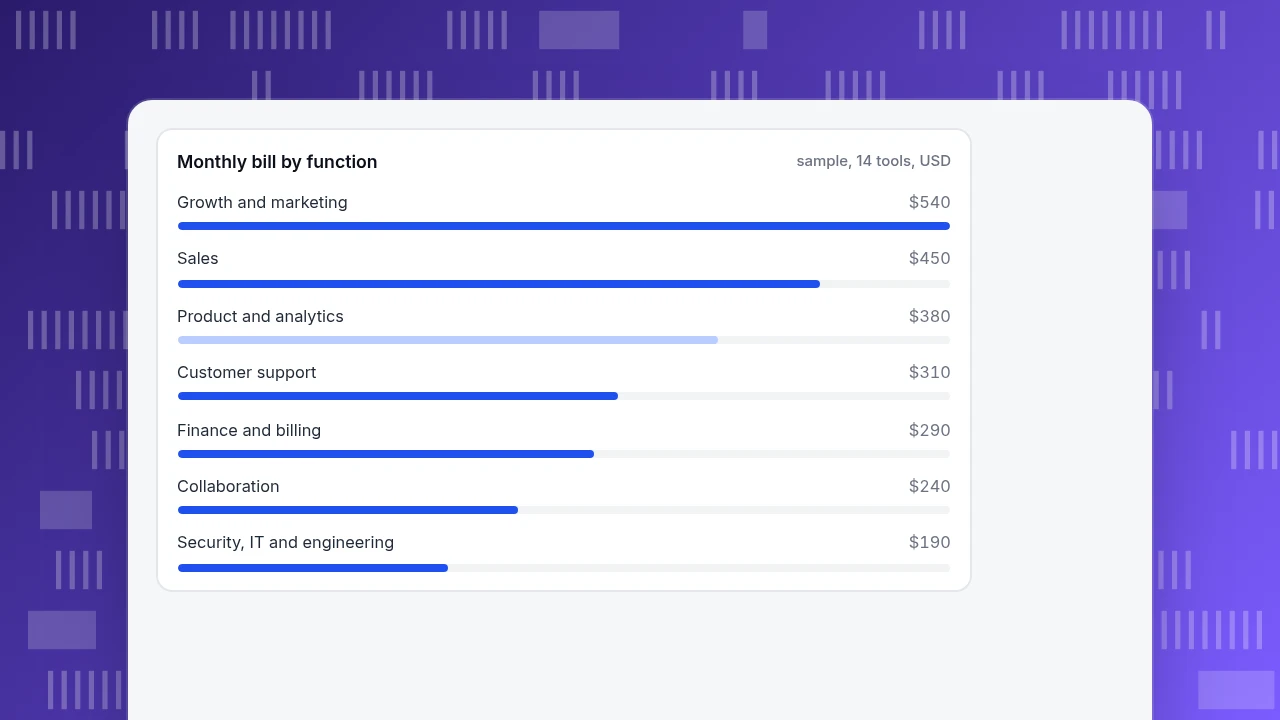
Sample data: a 12-person SaaS startup audited its stack. It had 14 tools and a monthly bill of $2,400:
| Function | Tools | Monthly cost |
|---|---|---|
| Growth and marketing | 3 | $540 |
| Product and analytics | 2 | $380 |
| Customer support | 2 | $310 |
| Sales | 2 | $450 |
| Finance and billing | 2 | $290 |
| Collaboration | 2 | $240 |
| Security, IT and engineering | 1 | $190 |
| Total | 14 | $2,400 |
That is 2,400 ÷ 12 = $200 per person per month before anyone has asked whether each tool is used.
Monthly bill by function
sample, 14 tools, USDHow do you decide whether to add a tool?
Before buying, answer six questions in writing. If you cannot, wait a month.
| Question | A good answer sounds like |
|---|---|
| What function does it serve? | "Product and analytics" |
| Which decision does it change? | "What we fix next sprint" |
| Who owns it? | A named person, not "the team" |
| What customer data does it hold, and where is the source of truth? | "Visitor events; the billing tool stays the source for revenue" |
| Does it overlap a tool we already pay for? | "No" or "Yes, and we will retire X" |
| How do we leave? | "Export in CSV; one week to move" |
Then price it honestly. The subscription is only part of it. Sample data: a tool billed at $12 per seat for 25 seats costs $300 a month, but only 17 people use it. Idle seats cost 8 × $12 = $96. Add 3 hours a month of administration at $40 an hour = $120. The real monthly cost is 300 + 120 = $420, or 420 ÷ 17 ≈ $24.71 per active user, about twice the sticker price of $12.
| Line | Calculation | Per month |
|---|---|---|
| Subscription | 25 seats × $12 | $300 |
| Idle seats (part of the above) | 8 unused × $12 | $96 |
| Administration | 3 hours × $40 | $120 |
| Real monthly cost | 300 + 120 | $420 |
| Per active user | 420 ÷ 17 active users | $24.71 |
The sticker price per seat was $12; the cost per person who actually uses the tool is about twice that.
How do you audit the stack you already have?
Once a quarter, list every tool, its function, owner, monthly cost, seats billed and seats active. Then apply two cuts: overlap (two tools for one function) and idle seats.
Sample data, continuing the 14-tool startup: the product and analytics function had two tools that both counted sessions, and one of them cost $190 a month. Retiring it saves $190. A collaboration tool had 8 idle seats at $12 each: $96. Together:
| Cut | Monthly saving |
|---|---|
| Retire the overlapping tool | $190 |
| Remove idle seats | $96 |
| Total | $286 |
The bill falls from $2,400 to 2,400 − 286 = $2,114, a reduction of 286 ÷ 2,400 = 11.9%, and the stack drops to 13 tools. The bigger win is usually simpler: fewer places where the same customer exists.
How do you manage data and risk across tools?
Every tool that holds customer information is another copy of it. Three habits keep this under control:
- Name one source of truth per fact. Revenue lives in billing, support history in the support tool, behaviour in analytics. Other tools read, not own.
- Know which tools are processors of personal data. Under the EU General Data Protection Regulation, a controller may use only processors that provide sufficient guarantees (Article 28), so keep a list and a contract for each. This is not legal advice.
- Ask for assurance reports. A SOC 2 report is an independent accountant's report on a service provider's controls over security, availability, processing integrity, confidentiality and privacy. It is one input to a decision, not a pass or fail.
Fewer tools means fewer processors to list and fewer reports to read, which is another quiet argument for the audit.
How do you retire a tool without losing data?
Cutting a tool is where audits stall, because nobody wants to lose history. Use a short, dated checklist:
| Step | What to do | Done when |
|---|---|---|
| 1. Export | Download the data in an open format such as CSV and store it | You can open the file and spot-check ten records |
| 2. Map | List who uses the tool and which other tools read from it | Every user and integration has a replacement or a decision to drop it |
| 3. Run in parallel | Keep both tools for one to two reporting cycles | The two tools agree within a tolerance you chose beforehand |
| 4. Switch the owner | Name the owner of the replacement and move the reports | The weekly report no longer opens the old tool |
| 5. Cancel at renewal | Cancel before the renewal date and note it in your calendar | The cancellation is confirmed in writing |
Sample data: the startup above retires the overlapping analytics tool. It runs both for two weeks and sets the tolerance at 5%. Weekly sessions read 9,800 and 10,100 in the two tools, a gap of 300 ÷ 10,100 ≈ 3.0%, inside the tolerance, so the team keeps one definition of "session" and cancels at renewal. If the gap had been 12%, the first job would be to find out why before cutting anything.
Which mistakes build a bloated stack?
- Buying by category instead of by function. A "top tools" list tells you what exists, not what you need.
- No owner. An unowned tool is billed month after month and reviewed never.
- Paying for the seat count at signup. In the example, 25 seats bought, 17 used.
- Two tools, one job. Two analytics tools disagree and teams argue about which number is right.
- Treating the sticker price as the cost. In the example the real figure was $420 against $300.
- No exit plan. If data cannot be exported, switching costs are part of the price.
How do TapCub's analytics and chat fit into a SaaS stack?
Return to the 14-tool startup. TapCub covers two of the eight functions, analytics and customer support, and it does so with one script and one visitor ID.
- Find the rows it could replace. Mark the product and analytics row and the customer support row in your audit. If you pay for separate analytics and chat tools, that is two scripts, two visitor IDs and one integration to maintain.
- Install one script. Get the code from Web analytics › Configuration › SDK code. Websites, apps and mini programs send to the same project and share one event and user model.
- Turn on chat. On a site that already has the script, switch on live chat in Live chat › Chat settings › Appearance; no site change is needed.
- Read each conversation with context. In Live chat › Inbox, an agent sees the visitor's source, current page and last two days of browsing, and can open the analytics profile in one click, because both products use the same visitor ID.
- Name your users. After login, calling
tapcub.loginlinks the person to the profile in All-platform analytics › Users › People, with a day-by-day timeline, and support knows who is writing.
TapCub does not replace the CRM, email marketing, billing or payments, surveys, A/B testing or feature flags; those rows stay with other tools, and TapCub only measures. Check TapCub's coverage against your own function table before cancelling anything.
FAQ
What are SaaS tools?
Applications you rent and use through a browser or interface over the internet, with the provider running the infrastructure. In practice the term covers the whole set of subscriptions a company uses: analytics, support, CRM, billing, documents and more.
How do you choose SaaS tools for your business?
Choose the function first, then the tool. Name the decision it supports, an owner, what customer data it holds, whether it overlaps something you already pay for, and how you would leave. If you cannot answer these, postpone the purchase.
How many SaaS tools does a startup need?
There is no fixed number. As a sample, 5 to 7 tools can cover a company before launch, 8 to 10 with the first customers and 11 to 14 once sales is repeatable. Count per function, and treat two tools for one function as a warning.
How do you reduce SaaS costs?
Audit quarterly for overlap and idle seats. In the sample, retiring one of two analytics tools saved $190 and removing 8 idle seats saved $96 a month, together 11.9% of a $2,400 bill, before any negotiation.
Are SaaS tools safe?
It depends on the provider and your configuration. Keep a list of tools that process personal data, review their security reports such as SOC 2 and limit who has access. This is a risk review, not a guarantee; take legal advice where data protection law applies.
See also: Marketing Technology Solutions: Map Your Stack by Data Flow.
Sources
- Peter Mell and Timothy Grance, NIST. The NIST Definition of Cloud Computing, SP 800-145. The definition of software as a service.
- AICPA. SOC 2 reports. What a SOC 2 examination covers.
- European Union. General Data Protection Regulation (EU) 2016/679, Article 28 on processors.
Was this article helpful?
We use your answers to fix and expand this page.
Couldn’t send. Please try again in a minute.
Thanks for the feedback. We’ll use it to improve this page.You’ve already sent feedback on this page. Thanks.

Product Experience Specialist
Explores usability, user journeys, and feature adoption through practical examples of onboarding and everyday product use.