Try it on your own data
Every report in this article is in the free plan. One snippet for web and apps, up to 10 sites.
Start freeA sales dashboard should hold only the metrics that change what the team does this week: leads, stage conversion, sales cycle and amount against quota. Everything else is a small input tile at most. Below are the formulas, a month of sample numbers, and a pipeline coverage calculation that turns the win rate into a plan.
What you will learn
- Keep a tile only if its movement would change someone's action
- Measure conversion on a cohort of leads, not on whatever closed this month
- Coverage = open pipeline ÷ quota; the target is 1 ÷ win rate
What belongs on a sales dashboard?
A sales dashboard belongs to one decision: what should the team do differently this week? So the test for every tile is simple. If it goes up or down, would anyone act differently? If not, remove it.
That test cuts most dashboards down to four groups of numbers, which follow the order of a sale:
| Group | Question it answers | Typical metrics | The action it triggers |
|---|---|---|---|
| Leads | Is enough new demand coming in? | New leads, leads by source, qualified-lead share | Shift effort between sources |
| Conversion | Where do deals fall out? | Stage-to-stage rates, win rate | Coach or fix the weakest stage |
| Cycle | How long does a sale take? | Median days from first touch to close | Set realistic forecasts and follow-up timing |
| Amount | How much is it worth? | Average deal size, revenue against quota, pipeline coverage | Decide how much pipeline to build |
Everything else, such as call counts, logins and email opens, is an input worth a small tile at most, and only for a rep or manager who is coaching on that behaviour. For a wider look at dashboards of every kind, see KPI dashboard and analytics dashboard; for the analysis behind the numbers, see sales analysis.
How do you calculate the four groups of sales metrics?
Each group needs one or two precise formulas, written down so that two people compute the same number:
- Stage conversion rate = deals that reached the next stage ÷ deals that reached this stage, for the same group of deals.
- Win rate = deals won ÷ opportunities that reached a decision in the period. Decide up front whether open deals count; most teams exclude them.
- Lead-to-win rate = deals won ÷ leads created in the cohort. It is the product of every stage rate.
- Sales cycle = median days from the first touch to close, over won deals. Use the median because one very slow deal distorts an average.
- Average deal size = revenue won ÷ deals won.
- Quota attainment = revenue won ÷ quota for the period.
- Pipeline coverage = value of open pipeline ÷ quota still to close.
Two cautions. Measure conversion on a cohort (all leads created in one month, followed to the end), not on whatever closed this month, or a long cycle will make the rates swing. And report amounts on the same basis everywhere, either booked revenue or contract value, never a mix.
Worked example: what does one month of numbers say?
Sample data: a small sales team, one month, a median cycle of 42 days.
| Stage | Count | Rate to next stage |
|---|---|---|
| New leads | 1,000 | 25.0% |
| Qualified leads | 250 | 40.0% |
| Opportunities | 100 | 20.0% |
| Won deals | 20 | n/a |
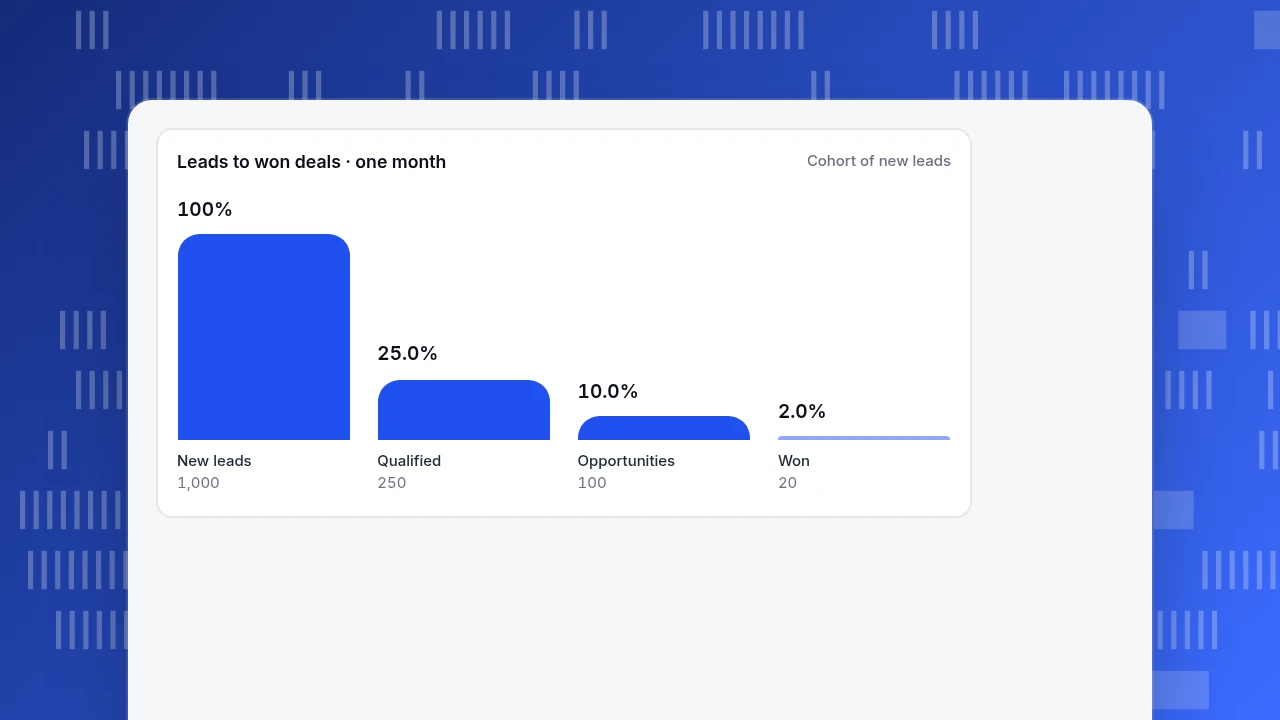
Recomputed: 250 ÷ 1,000 = 25.0%; 100 ÷ 250 = 40.0%; 20 ÷ 100 = 20.0%. The lead-to-win rate is 20 ÷ 1,000 = 2.0%, which equals 0.25 × 0.40 × 0.20.
At an average deal size of $6,000, won revenue is 20 × $6,000 = $120,000. Against a monthly quota of $150,000, attainment is $120,000 ÷ $150,000 = 80%.
What the dashboard should make you do:
- Find the weakest stage. The rate that looks lowest, 20% from opportunity to won, is normal for many B2B sales; the 25% from lead to qualified is the one marketing and sales jointly control, so a fix there lifts everything below it.
- Price an improvement. Moving lead-to-qualified from 25% to 30% gives 300 qualified leads, 120 opportunities at the same 40% and 24 wins at 20%: 4 more deals, or $24,000.
- Respect the lag. With a 42-day median cycle, this month's new leads close around six weeks from now. A leads tile that dips today will show up in revenue next month and the month after. The dashboard should show the lag, not hide it.
Leads to won deals · one month
Cohort of new leadsNew leads
1,000
Qualified
250
Opportunities
100
Won
20
How much pipeline do you need? Coverage in one formula
Coverage turns the win rate into a planning number. If you win 20% of opportunities by value, you need 1 ÷ 0.20 = 5 times your quota in open pipeline.
Sample data for next quarter: a quota of $450,000 and an open pipeline of $1,500,000.
| Item | Value |
|---|---|
| Quota | $450,000 |
| Win rate | 20% |
| Pipeline needed | $450,000 ÷ 0.20 = $2,250,000 |
| Pipeline you have | $1,500,000 |
| Coverage | 1,500,000 ÷ 450,000 = 3.3 times |
| Shortfall | $750,000, or 125 more opportunities at $6,000 |
The shortfall number is the action. It tells marketing and the reps how much more qualified demand to create in the next weeks, and because of the 42-day cycle, the answer is needed now. If your win rate is 33%, the same quota needs only 3 times coverage, which is why the win rate has to be recomputed each quarter and not copied from last year.
| Group | Question it answers | The action it triggers |
|---|---|---|
| Leads | Is enough demand coming in? | Shift effort between sources |
| Conversion | Where do deals fall out? | Coach or fix the weakest stage |
| Cycle | How long does a sale take? | Set realistic forecasts and follow-up |
| Amount | How much is it worth? | Decide how much pipeline to build |
One tile per group plus coverage is enough for a first version.
Which view should the rep, the manager and the executive see?
One dashboard for everyone ends up useful to no one. Keep the four groups, and change how much of each the viewer sees:
| Viewer | Main view | Refresh | What they do with it |
|---|---|---|---|
| Rep | Own open deals, next steps, own quota progress | Daily | Decide whom to contact today |
| Manager | Stage rates by rep, cycle by segment, coverage for the team | Weekly | Choose who to coach and which stage |
| Executive | Revenue against quota, coverage, lead-to-win trend | Monthly | Decide on hiring and budget |
Show a team metric next to any individual ranking, or the board turns into a leaderboard that rewards gaming. And show two time frames, such as this week and the last 90 days, so a quiet week does not look like a trend.
How do you build a sales dashboard in five steps?
- Write the decision. One sentence: "We decide how much pipeline to build next month."
- Pick at most one tile per group, plus coverage. Four to six tiles is plenty for the first version.
- Write each formula in a caption, including what counts as a lead, a qualified lead and a win. Disagreements about definitions are the most common reason a dashboard is not trusted.
- Connect one source of truth per number. Pipeline values come from your customer database or CRM; website leads come from your site analytics. Do not retype numbers.
- Review it weekly and prune it monthly. Remove any tile nobody acted on in the last month.
Common mistakes on sales dashboards
- Counting activity, not outcomes. Calls made and emails sent describe effort; they do not describe the funnel.
- Using all-time averages. A 12-month average hides a stage that broke last month.
- Measuring conversion on whoever closed. Use a cohort; in the example, the 2.0% lead-to-win rate belongs to the leads created this month, not to the wins booked this month.
- Forgetting the lag. Judging marketing by this month's revenue punishes work that pays in six weeks.
- Mixing definitions of a lead. If two teams define a lead differently, the 25% qualification rate means two things.
- Showing only a leaderboard. It rewards the loudest rep and tells the manager nothing about the weakest stage.
What can TapCub contribute to a sales dashboard?
Take the team above. TapCub is not a CRM: it has no deal pipeline, no stage tracking and no lead scoring, so opportunities, quota and deal sizes stay in your sales system. What TapCub covers is the top of the funnel, the part that happens on your website and in live chat. Here is how that fills the leads group.
- Define a lead as a goal. In Web analytics › Goals (the same data appears under All-platform analytics › Business › Goals), create a goal for the form submission or sign-up event. Goal conversion rate is distinct converting visitors ÷ distinct visitors in the range, and the goal can carry revenue if you send a numeric property.
- Split leads by source. Web analytics › Sources shows conversions per channel and UTM campaign, so you can see which sources send leads and shift effort accordingly. If you import ad spend in All-platform analytics › Business › Channel ROI, you also get cost per click, cost per acquisition and return on ad spend per channel.
- Identify who the lead is. After a visitor logs in and you call
tapcub.login, the person appears in All-platform analytics › Users › People with a day-by-day behaviour timeline, which gives a sales rep context before the first call. - Put the numbers on a board. Save analyses and place them as cards on a dashboard under All-platform analytics › Overview › My dashboards; define a ratio you review often in All-platform analytics › Behavior › Metrics & SQL; and share a read-only link if someone outside the team needs to see it. Shared dashboards show at most the last 90 days.
- Watch for breaks. Add a monitor in All-platform analytics › Operations › Monitors, for example on visitors falling below a threshold. It only notifies you; it does not act.
Live chat adds one more lead source. Live chat › Reports › Conversion attribution compares the goal rate of visitors who chatted with those who did not, and treats the gap as an upper bound because people who chat were already closer to buying.
TapCub does not score leads, track opportunities or forecast revenue. It measures how many people arrive, from where, and whether they reach your goal.
FAQ
What is a sales dashboard?
A sales dashboard is a single screen of the few numbers a sales team uses to decide what to do next: lead volume, conversion between stages, cycle length and amount against quota. It replaces scattered reports with one agreed set of definitions.
What metrics should be on a sales dashboard?
Start with one metric per group: new leads, a stage conversion rate or win rate, median sales cycle, and revenue against quota, plus pipeline coverage. Add activity metrics such as calls only for a manager coaching on that behaviour.
How often should a sales dashboard be updated?
Reps benefit from daily data on their own deals; managers from a weekly review; executives from a monthly view. The dashboard should refresh at least as often as the decision it supports, but not so often that normal week-to-week noise looks like a trend.
How do you calculate pipeline coverage?
Divide the value of open pipeline by the quota still to close. The target is 1 ÷ win rate. At a 20% win rate you need 5 times coverage; in the sample, $1,500,000 against a $450,000 quota is 3.3 times, a $750,000 shortfall.
Do I need a CRM to build a sales dashboard?
For pipeline stages, deal amounts and quota, yes: those numbers live in a sales system. For the top of the funnel, such as website leads by source and conversion rate, web analytics can supply the numbers and you can combine both on one board.
See also: Retail Analytics Dashboard: A 10-Metric Layout With Formulas.
Sources
- Stephen Few. Dashboard Confusion. Perceptual Edge, 2004 — the definition of a dashboard as the most important information on a single screen, monitored at a glance. Verified 2026-11-19.
- Wikipedia. Dashboard (business) — background on business dashboards and how they relate to key performance indicators. Verified 2026-11-19.
Was this article helpful?
We use your answers to fix and expand this page.
Couldn’t send. Please try again in a minute.
Thanks for the feedback. We’ll use it to improve this page.You’ve already sent feedback on this page. Thanks.

Data Engineer
Writes about event design, data quality, and collection workflows, with verifiable implementation methods for reliable analytics.