Try it on your own data
Every report in this article is in the free plan. One snippet for web and apps, up to 10 sites.
Start freeSales analysis explains how much you sold, to whom, through which channel and at what price, and why those numbers changed. Its core is splitting any revenue change into volume × price × mix. Skip the split and a price increase looks like growth. Below: the types of sales analysis, a worked example where revenue rose 1.8% while sales at constant prices fell 6.1%, the steps and a report structure.
What you will learn
- Split every revenue change into volume, price and mix before drawing conclusions
- Show revenue at constant prices next to reported revenue; price rises can hide falling sales
- Locate the change by channel and customer, then write the report answer-first
What is sales analysis?
Sales analysis is the work of explaining how much you sold, to whom, through which channel and at what price, and above all why those numbers changed. A sales report tells you revenue was $519,400 this year. A sales analysis tells you whether that came from selling more units, charging more per unit or selling a different mix of products, because each of those leads to a different decision.
The questions it answers fall into a few groups:
- How much and how fast? Revenue, units and orders over time, and their growth rate.
- What did we sell? Revenue and units by product, category and price point.
- Who bought? New versus repeat customers, revenue per customer, customer segments.
- Where did it come from? Revenue and return by channel, campaign and region.
- Why did it change? The split of a revenue change into volume, price and mix, which is the core of this article.
Sales analysis assumes your revenue data is already being collected correctly: orders deduplicated, refunds recorded, currencies handled. Setting that up is covered in revenue tracking. This article starts once the data is there.
What are the types of sales analysis?
The types below differ in which cut of the data they use and which question they answer. The table lists each one with its key cut and a typical output. In practice, a good sales analysis uses two or three of them together: a trend shows that something changed, and a volume-price-mix split or a customer cut explains what.
Trend analysis is where most people start: revenue by week or month, with a comparison period. Compare against the same period last year when your business is seasonal; month over month comparisons of December against November say more about holidays than performance. How to calculate and present growth correctly is in revenue growth rate.
Product and composition analysis ranks products and categories by revenue and units, and tracks their share of the total. Share matters as much as size: a category can grow in revenue and still lose share, pulling the average price down.
Channel analysis splits revenue by acquisition channel and, if you have the spend, sets it against cost. Revenue without spend tells you volume, not efficiency.
Customer analysis splits revenue into buyers, orders per buyer and order value, and compares new with repeat customers. It often finds that growth depends heavily on one group.
Volume-price-mix analysis splits a change in revenue into three causes. It is the type most guides skip and the one that most often changes a conclusion, so the next three sections cover it in detail.
| Type | Question it answers | Key cut | Typical output |
|---|---|---|---|
| Trend | Is revenue growing, and how fast? | Time, with a comparison period | Revenue by month vs same month last year |
| Product and composition | What are we selling? | Product, category, price point | Category ranking and share of revenue |
| Channel | Where do sales come from? | Acquisition channel, campaign, region | Revenue and return on spend by channel |
| Customer | Who is buying? | New vs repeat, segment | Buyers × orders per buyer × order value |
| Volume-price-mix | Why did revenue change? | Category units and prices, two periods | Volume, price and mix effects that sum to the change |
A trend shows that something changed; a volume-price-mix split or a customer cut explains what.
Why split revenue into volume, price and mix?
Revenue is units multiplied by average price. The average price, in turn, depends on two things: the price of each product and the mix of products sold. So any change in revenue has three possible sources:
- Volume — you sold more or fewer units in total.
- Price — you charged more or less for the same products.
- Mix — customers bought a different combination of cheaper and more expensive products.
Without splitting, a price increase looks exactly like growth. Raise prices 10%, sell 5% fewer units, and revenue still rises about 4.5%. A dashboard shows a green arrow; the business is selling less.
This is not a niche technique. National accountants separate every value into quantity and price for the same reason: the U.S. Bureau of Economic Analysis describes current-dollar data as reflecting the product of quantity and price, and builds separate quantity and price estimates from it. Large consumer companies report sales changes the same way. Procter & Gamble's fiscal 2025 annual report breaks net sales growth for each segment into volume, foreign exchange, price and mix. Its Beauty segment's net sales fell 2%: unfavourable mix of 2%, from the decline of a super-premium brand, plus 1% from foreign exchange and 1% lower volume, partly offset by higher pricing.
A small business does not need currency effects or acquisitions in the split, but it needs the same three core parts.
Worked example: volume, price and mix
Sample data. A clothing store sells three categories. Comparing this year with last year:
| Category | Units last year | Price last year | Revenue last year | Units this year | Price this year | Revenue this year |
|---|---|---|---|---|---|---|
| Accessories | 6,000 | $20 | $120,000 | 7,500 | $21 | $157,500 |
| Shoes | 3,000 | $80 | $240,000 | 2,800 | $88 | $246,400 |
| Jackets | 1,000 | $150 | $150,000 | 700 | $165 | $115,500 |
| Total | 10,000 | $51.00 avg | $510,000 | 11,000 | $47.22 avg | $519,400 |
Revenue rose $9,400, or 1.8%. Units rose 10%. Every price went up, by 5% to 10%. Yet the average price fell from $51.00 to $47.22. Here is the split, using last year's prices and mix as the baseline:
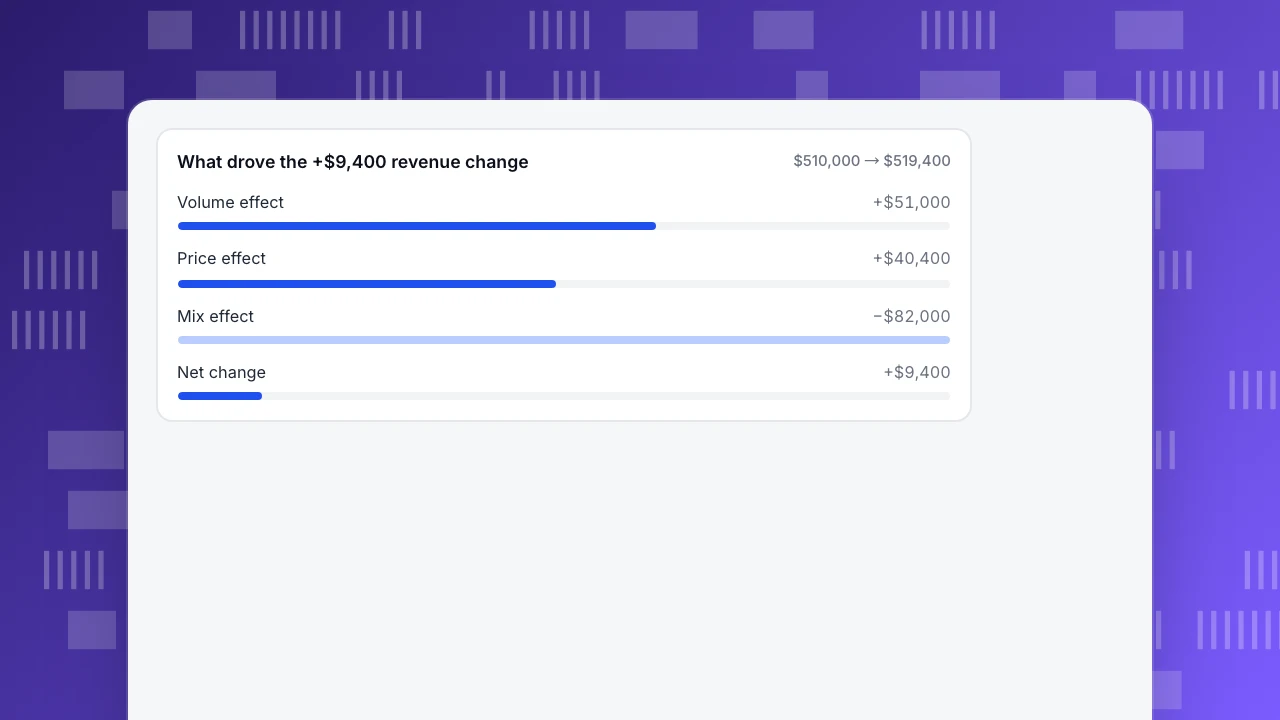
- Volume effect = (units this year − units last year) × last year's average price = 1,000 × $51.00 = +$51,000.
- Mix effect = units this year × Σ(change in each category's unit share × its price last year). Accessories' share rose from 60.0% to 68.2%, shoes fell from 30.0% to 25.5%, jackets from 10.0% to 6.4%. Accessories +$18,000, shoes −$40,000, jackets −$60,000: −$82,000.
- Price effect = Σ(units this year × change in price). Accessories 7,500 × $1 = $7,500; shoes 2,800 × $8 = $22,400; jackets 700 × $15 = $10,500: +$40,400.
Check: +$51,000 − $82,000 + $40,400 = +$9,400, the full change.
Now read it. Price increases added $40,400. Volume and mix together subtracted $31,000. At last year's prices, this year's units would have brought in $479,000, a 6.1% decline. The store is not growing; it is selling a cheaper mix and covering the gap with price increases. Jacket units fell 30% and shoe units 7%, while accessories carried the volume.
Without the split, the year reads "+1.8%, prices held, volume up 10%". With it, the questions become specific: why did jacket buyers leave, did the shoe price increase cost units, and can accessories buyers be moved up to shoes?
What drove the +$9,400 revenue change
$510,000 → $519,400How to do a sales analysis, step by step
- Write the question and the comparison. "Why did revenue grow only 1.8% this year when units rose 10%?" Choose the comparison period on purpose: year over year for seasonal businesses, and periods with the same number of trading days.
- Clean the revenue data. Use one currency, deduplicate orders by order ID, decide whether you analyse gross sales or sales net of refunds, and say which. Mixing gross and net between periods creates fake growth.
- Split revenue into its multiplication. At the order level, revenue = orders × average order value; at the customer level, buyers × orders per buyer × order value; at the product level, units × price. Each split shows which factor moved.
- Run volume, price and mix by category. Use the formulas in the worked example. Keep categories few enough (three to ten) that the mix effect is readable.
- Cut by channel and customer. Check whether the change is concentrated in one channel, region or customer group before generalising.
- Write it up answer-first. Lead with the split and its implication, then the evidence and definitions. The structure is in data analysis report.
How do channel and customer cuts change the reading?
Volume, price and mix tell you what changed in the product mix. Channel and customer cuts tell you where and among whom. Rules of thumb for reading them:
- If one channel explains most of the volume change, check whether its traffic or its conversion moved. A paid campaign that stopped is a budget question, not a demand question.
- If revenue per customer rises while buyers fall, you are getting more from fewer people. Check whether repeat customers are carrying the period while new-customer acquisition weakens. ARPU and repeat rate are the metrics to watch.
- If new customers buy the cheap category and repeat customers buy the expensive one, mix effects will follow your acquisition mix. A month with a big acquisition push will show a negative mix effect that is actually healthy.
- If a channel's revenue is high but you have not set spend against it, you know its volume, not its value. Return on ad spend needs cost; see ROI and ROAS.
- If the period is short, annualising it can mislead. An annual run rate built from one strong month overstates the year; see annual run rate.
For an e-commerce business, the full set of metrics these cuts draw on is in e-commerce KPIs.
What should a sales analysis report include?
A sales analysis report follows the same answer-first structure as any analysis, with sales-specific content in each part:
- Answer — the revenue change and its split. "Revenue +1.8%: price +$40,400, volume +$51,000, mix −$82,000. At constant prices, sales fell 6.1%."
- Evidence — the category table, the channel or customer cut that locates the change, and one trend chart with the comparison period.
- Recommendation — for each cause, an action and an owner: investigate jacket demand, test whether the shoe price rise cost units, build an accessories-to-shoes offer.
- Definitions — gross or net of refunds, currency and conversion rate, the date range, how categories were defined, which orders were excluded.
- Appendix — full product tables and the calculation.
Keep the category count small in the main report. Twenty categories make the mix effect unreadable; group them and put detail in the appendix.
Common sales analysis mistakes
- Counting price increases as growth. The central mistake. Always show revenue at constant prices next to reported revenue.
- Average price as a pricing signal. A falling average price can come entirely from mix, as in the example, while every list price went up.
- Mixing gross and net revenue. Refunds recorded in a different period make one month look strong and the next weak.
- Ignoring currency. Sales in several currencies need one base currency and a stated conversion rule, or exchange rates show up as growth.
- Month over month in a seasonal business. Compare with the same period last year.
- Too many categories. The mix effect needs groups large enough to mean something.
- Channel credit without cost. Revenue by channel is not channel performance until spend is set against it.
How to run a sales analysis with TapCub data
Here is how the clothing store's numbers would come out of TapCub, and which part of the split you still do yourself.
- Record purchases with line items. Send a purchase event from your server on payment success, with order id, amount and currency, and put line items in an
itemsarray; send refunds with the same order id. Track e-commerce purchases has the details. - Read revenue as orders × order value. All-platform analytics › Business › Commerce & revenue shows revenue, orders, buyers, average order (revenue ÷ orders), paying rate, revenue per buyer, first buyers and repeat rate, plus item, category and brand ranks from the line items. Amounts are converted into the site's base currency at the rate on the day of the order. Refunds are reported separately and not subtracted, so state in your definitions whether you analysed gross or net.
- Do the volume-price-mix split on exported rows. TapCub has no built-in price-volume-mix report. Export order and line-item rows from All-platform analytics › Data › Data export and apply the formulas above in a spreadsheet.
- Locate the change by channel, country or device. All-platform analytics › Operations › AI Assistant has a Why did it change tab that splits a metric's change versus the previous period or the same period last year by channel, referrer domain, country, device, entry page or platform, with each value's share of the total change.
- Set spend against channel revenue. In All-platform analytics › Business › Channel ROI, import spend by day, channel, source and campaign (CSV or one entry at a time). The page shows cost per click (spend ÷ sessions), cost per acquisition (spend ÷ purchases) and return on ad spend, grouped by channel, source or campaign.
FAQ
What are the types of sales analysis?
The common types are trend analysis (revenue over time against a comparison period), product and composition analysis (revenue and share by category), channel analysis (revenue and cost by acquisition source), customer analysis (new versus repeat, revenue per customer) and volume-price-mix analysis, which splits a revenue change into units sold, price changes and product mix. Most useful analyses combine two or three of these.
How do you do a sales analysis?
Write the question and comparison period, clean the data (one currency, deduplicated orders, gross or net stated), split revenue into its factors (orders × order value, or units × price), run volume, price and mix by category, cut by channel and customer to locate the change, and write it up with the answer first. The split is what turns a revenue number into an explanation.
What is price volume mix analysis?
It splits a revenue change into three parts: volume (more or fewer units in total), price (higher or lower prices for the same products) and mix (a shift between cheaper and more expensive products). In the example, revenue rose $9,400: volume +$51,000, price +$40,400, mix −$82,000. It shows when price increases hide falling underlying sales.
What should a sales analysis report include?
The revenue change and its volume, price and mix split up front; then evidence such as the category table and the channel or customer cut that locates the change; a recommendation with an owner for each cause; definitions covering gross or net revenue, currency, dates and exclusions; and an appendix with the full tables and calculation. Show revenue at constant prices next to reported revenue.
What is the difference between sales analysis and sales forecasting?
Sales analysis explains past results: what was sold, to whom, and why revenue changed. Sales forecasting estimates future results from past patterns and planned changes. Analysis feeds forecasting: if you know that last year's growth came from price rather than volume, you will not forecast next year by simply extending the revenue trend.
See also: Sales Dashboard: The Four Metric Groups That Drive Action.
Sources
- The Procter & Gamble Company. Annual Report on Form 10-K for the fiscal year ended June 30, 2025 — "Net Sales Change Drivers 2025 vs. 2024" table and Beauty segment discussion. U.S. SEC EDGAR.
- U.S. Bureau of Economic Analysis. NIPA Handbook, Chapter 4: Estimating Methods — current-dollar estimates and quantity and price estimates.
Was this article helpful?
We use your answers to fix and expand this page.
Couldn’t send. Please try again in a minute.
Thanks for the feedback. We’ll use it to improve this page.You’ve already sent feedback on this page. Thanks.

Data Analyst
Explores traffic sources, conversion funnels, and retention, using clear metric definitions and concrete examples to explain what the numbers mean.