Try it on your own data
Every report in this article is in the free plan. One snippet for web and apps, up to 10 sites.
Start freeA data analysis report works best written upside down: the conclusion and recommendation go first, the method and data last. Every conclusion carries the definitions someone needs to check it: time range, denominator and filters. Below: a five-part template, a definitions checklist, a worked example that splits a 0.6-point conversion drop into causes, and which chart fits which claim.
What you will learn
- Lead with the answer and the recommendation; put method and data in the back
- Attach a definitions block to every headline number: formula, time range, denominator, filters, exclusions
- Split a metric change into causes before writing; the split is the evidence section
What is a data analysis report?
A data analysis report is a written document that answers one business question with data: what happened, why, and what to do about it. It differs from a dashboard in purpose. A dashboard shows the current state of many numbers and leaves the reading to you; a report makes an argument about a few of them and stands behind it. "Analytical report" and "analysis report" are the same thing under other names.
Most reports fall into one of three kinds, matching the questions in types of data analytics:
- Descriptive — what happened. A monthly performance summary, a campaign wrap-up.
- Diagnostic — why it happened. A conversion drop, a spike in refunds, a channel that stopped working.
- Recommendation — what to do next. A proposal to shift budget, cut a feature or change a price, backed by evidence.
The structure in this article works for all three, but it matters most for diagnostic reports, where readers need to trust a causal story before they act on it. If your report is specifically about website traffic, the metrics and sections to include are covered in web analytics report; this article is about how to structure and write any analysis so others can read and check it.
Why write the report upside down?
Write the report upside down: conclusion and recommendation first, method and data last, and attach to every conclusion the definitions someone would need to check it — the time range, the denominator and the filters.
Most analysts write in the order they worked: question, data, method, findings, conclusion. That order is natural to write and painful to read. The person who asked the question usually reads the first paragraph, maybe the first page, and decides. If the answer is on page four, it competes with everything before it.
The U.S. government's plain-language guidance gives the same rule for any document: put the most important information first and move background toward the end. Journalists call it the inverted pyramid. For a data report, it means this order:
- Answer — the conclusion in one or two sentences, with the key number.
- Evidence — the two to four findings that support it, each with a number and a chart.
- Recommendation — what to do, who owns it, by when, and how you will know it worked.
- Definitions — exactly how each number was calculated.
- Method and appendix — data sources, steps, rejected explanations, raw tables.
The table below lists what goes in each section and how long it should be. The reader who stops after section 1 gets the answer; the reader who wants to challenge it finds everything they need in sections 4 and 5. Writing this way also tests your analysis: if you cannot state the answer in two sentences, the analysis is not finished.
| Section | What goes in | Length |
|---|---|---|
| 1. Answer | The conclusion with the key number and comparison | 1–2 sentences |
| 2. Evidence | 2–4 findings, each a claim with a number and a chart | Half a page to a page |
| 3. Recommendation | Action, owner, deadline, success metric | A few lines |
| 4. Definitions | Formula, time range, denominator, filters, exclusions, source | A small table |
| 5. Method and appendix | Data sources, steps, rejected explanations, full tables | As long as needed |
Readers who stop after section 1 still get the answer; readers who want to challenge it go to sections 4 and 5.
What goes in each section?
Answer. One claim, one number, one comparison. "Conversion fell from 3.2% to 2.6% in October mainly because paid search stopped converting after the landing page change on 3 October." Avoid hedged openers like "This report examines…"; that sentence tells the reader nothing they did not know from the title.
Evidence. Each finding is a sentence that could be true or false, followed by the number and a chart that shows it. Keep findings to the ones that support or limit the answer. A finding that is interesting but changes nothing goes to the appendix. If a reasonable reader would ask "but what about X?", answer it here in one line, and put the analysis behind it in the appendix.
Recommendation. Name the action, the owner, the deadline and the metric that will show whether it worked. "Restore the old paid landing page by 20 October (owner: growth lead); expect paid conversion back above 3% within two weeks." A recommendation without an owner tends to stall. Use actionable metrics for the success measure, not the headline number that moves for many reasons.
Definitions. The block that makes every number checkable, described in the next section.
Method and appendix. Data sources and extraction date, the steps you took, explanations you tested and rejected (and why), and full tables. This is where a sceptical reader goes. If you ruled out tracking breakage or a bot spike, say how.
The definitions block: what makes a number checkable?
Two analysts can pull "conversion rate for October" and get different answers, both correct. One divided orders by sessions, the other by unique visitors; one used UTC, the other local time; one excluded internal traffic. Readers cannot tell which unless you write it down.
The U.S. Census Bureau's statistical quality standards set the bar for public statistics: documentation must let qualified users understand, reproduce and evaluate the results. A business report does not need a methods appendix of that size, but it needs the same core items. For each headline number, list:
- Metric and formula — "Conversion rate = orders ÷ unique visitors."
- Time range and time zone — "1–31 October 2026, site time zone (UTC−5)."
- Comparison period — previous period, same period last year, or a fixed baseline, and why.
- Denominator — who is counted: visitors, sessions, signed-in users, customers.
- Filters and segments — country, device, channel or plan restrictions.
- Exclusions — bots, internal traffic, test orders, refunds.
- Source and extraction time — which tool or table, and when it was pulled; data that arrives late can change.
- Known issues — tracking gaps, consent changes, outages during the period.
Put this block after the recommendation, as a compact table. A reader who doubts a number checks the definitions first, and in most disputes the answer is there.
Worked example: a 0.6-point drop in conversion
Sample data. An online store's visitor conversion rate fell from 3.20% in September to 2.60% in October, a drop of 0.6 percentage points. Visitors rose from 40,000 to 45,000 while orders fell from 1,280 to 1,170.
| Channel | Sept visitors | Sept orders | Sept rate | Oct visitors | Oct orders | Oct rate |
|---|---|---|---|---|---|---|
| Organic search | 16,000 | 480 | 3.00% | 16,000 | 480 | 3.00% |
| Paid search | 10,000 | 350 | 3.50% | 9,000 | 180 | 2.00% |
| 4,000 | 240 | 6.00% | 4,000 | 240 | 6.00% | |
| Social | 6,000 | 60 | 1.00% | 12,000 | 120 | 1.00% |
| Direct | 4,000 | 150 | 3.75% | 4,000 | 150 | 3.75% |
| Total | 40,000 | 1,280 | 3.20% | 45,000 | 1,170 | 2.60% |
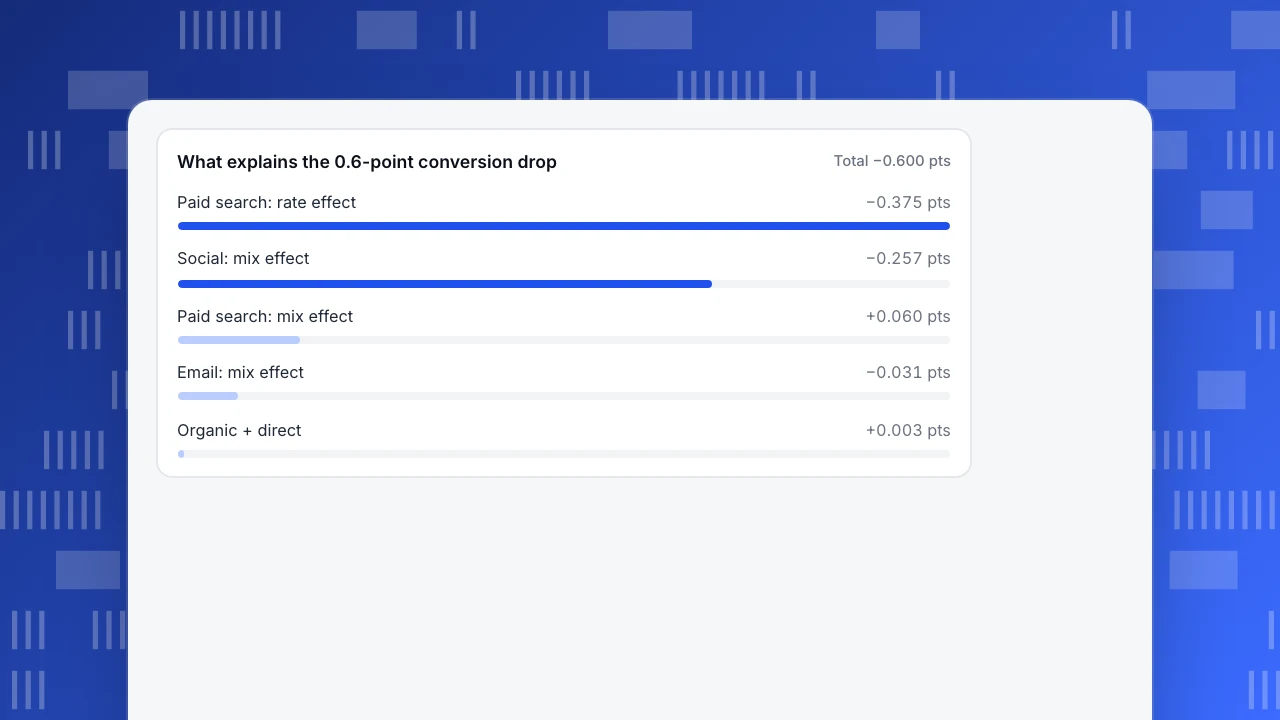
An overall rate is a weighted average: each channel's rate times its share of visitors. It can move for two reasons. A rate effect is a channel converting differently: September share × (October rate − September rate). A mix effect is traffic shifting between channels that convert above or below average: (October share − September share) × (October rate − September overall rate). The two sum exactly to the total change.
- Paid search, rate effect: 25% × (2.00% − 3.50%) = −0.375 points.
- Social, mix effect: its share rose from 15.0% to 26.7%, and it converts at 1.00% against a 3.20% average: 11.67% × (1.00% − 3.20%) = −0.257 points.
- Paid search, mix effect: share fell from 25% to 20% at 2.00%: −5% × (2.00% − 3.20%) = +0.060 points.
- Everything else: organic +0.009, email −0.031, direct −0.006.
Total: −0.375 − 0.257 + 0.060 + 0.009 − 0.031 − 0.006 = −0.600 points. Paid search explains −0.315 points (52.5% of the drop) and social −0.257 points (42.8%).
Written upside down, the report opens like this:
Answer. October conversion fell 0.6 points (3.20% → 2.60%). About half is paid search: its rate fell from 3.50% to 2.00% after the 3 October landing page change. Most of the rest is mix: social traffic doubled to 12,000 visitors from one viral post, and social converts at 1.00%. Recommendation. Roll back the paid landing page by 20 October (growth lead). Do not treat the social mix effect as a problem; report conversion excluding the viral post's traffic alongside the total for November. Definitions. Conversion rate = orders ÷ unique visitors; 1–30 Sept vs 1–31 Oct 2026, site time zone; bots and internal IPs excluded; orders from the store's order table, pulled 2 November.
Without the split, the team would have spent October debating the checkout. With it, one fix addresses half the drop, and the other half turns out to be good news diluting an average — the same trap described in Simpson's paradox.
What explains the 0.6-point conversion drop
Total −0.600 ptsWhich chart should each claim use?
Pick the chart from the claim, not from the data. Cleveland and McGill's experiments on graphical perception found that people judge position along a common scale more accurately than angles or areas, which is why bars and lines usually beat pies.
| If the claim is about… | Use | Avoid |
|---|---|---|
| A change over time | Line chart, with the event annotated | Bars for 30+ time points |
| Ranking or comparison | Horizontal bars, sorted | Unsorted bars, 3D |
| Composition of a total | Stacked bar or a simple table | Pie with more than five slices |
| Contribution to a change | Bars of contributions, positive and negative | Two side-by-side pies |
| A single key number | The number, its comparison and the change | A gauge |
Two rules apply to every chart in a report. The title states the finding ("Paid search conversion fell after 3 October"), not the topic ("Conversion by channel"). And every chart sits next to the sentence it supports; a chart that no sentence refers to goes to the appendix.
Common mistakes in data analysis reports
- Percent versus percentage points. A fall from 3.2% to 2.6% is 0.6 points or 18.75%. Write which one you mean.
- No denominator. "Orders fell by 110" means little without visitors. Report the rate and the counts behind it.
- Cherry-picked comparison period. Comparing against the best week of the year makes any week look bad. State why you chose the baseline.
- Method first. Three pages of data cleaning before the answer. Move it to the appendix.
- Findings without a claim. "Here is traffic by device" is a chart, not a finding. Write what it shows.
- Recommendation without an owner or a test. Every action needs a name, a date and a metric.
- Hidden limitations. If tracking broke for two days, say so in the definitions, not in a footnote nobody reads.
- Too many charts. If the evidence section has more than four or five, some are not supporting the answer.
The same discipline applies to choosing what to report at all; which numbers deserve a place is covered in metrics vs KPIs. A revenue-focused version of this structure is in sales analysis, and a weekly format for owners is in small business dashboard.
How to build the report from TapCub data
Here is how the October conversion drop from the example would come together in TapCub, from spotting the split to sharing the result.
- Find where the change came from. In All-platform analytics › Operations › AI Assistant, the Why did it change tab compares a metric with the previous period or the same period last year and splits the change by channel, referrer domain, country, device, entry page or platform, one or two levels deep, showing each value's share of the total change. That points you to paid search and social. The rate-versus-mix split above is a calculation you do on top, from each channel's visitors and conversions.
- Write the denominator into the definitions. Conversion rates in Web analytics › Goals divide by unique visitors in the selected dates, not by sessions. Recognised bots are counted separately in Web analytics › Bots and are not added to visitors. Both lines belong in your definitions block.
- Put the cause on the chart. Add the 3 October landing page change as an annotation in Configuration › Annotations (types include campaign, release and ads). Trend charts then show the step change next to its explanation.
- Attach raw data to the appendix. The console shows aggregated reports. For row-level data, run an asynchronous export from All-platform analytics › Data › Data export; detail older than your retention period has already been deleted, so pull it while it exists.
- Share the numbers behind the report. Configuration › Settings › Public sharing creates a read-only link, optionally with a password, limited to chosen modules (Overview, Pages, Sources, Audience, Bots) and a number of days. Visitor lists and sessions cannot be shared publicly. TapCub does not write the report itself; the answer, recommendation and definitions are yours.
FAQ
What should a data analysis report include?
Five parts, in this order: the answer in one or two sentences, two to four findings with numbers and charts, a recommendation with an owner and a deadline, a definitions block (metric formula, time range, denominator, filters, exclusions, source), and a method section with an appendix. The first three are for decision-makers; the last two let anyone check the work.
How long should a data analysis report be?
As short as the question allows. A diagnostic report on one metric usually fits on one or two pages plus an appendix: an answer paragraph, a few findings with a chart each, a recommendation and a compact definitions table. If the evidence section grows beyond four or five charts, some of them probably do not support the answer and belong in the appendix.
What is the difference between a data analysis report and a dashboard?
A dashboard shows many metrics continuously and leaves interpretation to the viewer. A data analysis report answers one question at one point in time, makes a claim, supports it with selected evidence and recommends an action. Dashboards help you notice that something changed; reports explain why and what to do. Teams usually need both, with the report linking to the dashboard.
What is a good data report format?
Use an inverted structure: answer, evidence, recommendation, definitions, then method and appendix. Give every chart a title that states its finding, put it next to the sentence it supports, and show both rates and counts. Keep the definitions in a small table so a reader can check any number's time range, denominator and filters in seconds.
How do you write recommendations in an analysis report?
Make each recommendation specific enough to assign: the action, the owner, the deadline and the metric that will show whether it worked, with the expected size of the change. Tie it to a finding in the report. If the evidence is observational, say what test or follow-up would confirm the cause before the team commits more budget.
See also: Business Reports: Types, Structure and a Template for Each Audience.
See also: Data Analysis Plan: How to Write One Before You Open the Data.
Sources
- Digital.gov. Organize the information — Federal plain language guidelines.
- U.S. Census Bureau. Statistical Quality Standard F2: Providing Documentation to Support Transparency in Information Products.
- Cleveland, W. S. & McGill, R. (1984). Graphical perception: theory, experimentation, and application to the development of graphical methods. Journal of the American Statistical Association, 79(387), 531–554.
Was this article helpful?
We use your answers to fix and expand this page.
Couldn’t send. Please try again in a minute.
Thanks for the feedback. We’ll use it to improve this page.You’ve already sent feedback on this page. Thanks.

Data Analyst
Explores traffic sources, conversion funnels, and retention, using clear metric definitions and concrete examples to explain what the numbers mean.