Try it on your own data
Every report in this article is in the free plan. One snippet for web and apps, up to 10 sites.
Start freeContent marketing analytics measures whether your content is seen, read and acted on, and uses those three layers to decide what to write, update or retire. Looking at traffic alone overrates viral posts and underrates slow, specific pages that convert. In the worked example below, an article with one-eighth of the traffic brings almost twice the signups.
What you will learn
- Judge every page on three layers: seen (impressions, clicks, position), read (scroll reach, time) and action (goal conversions)
- Traffic-only rankings can invert true value: Article B had 12.5% of Article A's sessions but 1.875× its signups
- Check first-touch credit with landing page as the touchpoint before cutting pages that start journeys
What is content marketing analytics, and what are its three layers?
Content marketing analytics is the practice of measuring whether your articles, guides and pages get found, get read, and lead readers to do something that matters to the business, then using those numbers to decide what to write, update or retire. The word that matters is "whether": a page can succeed at one layer and fail at the next, and each layer needs its own data source.
- Seen — does the content show up where readers look? Impressions, clicks, click-through rate and average position in search, plus visits from social, email and referrals.
- Read — do people who arrive actually consume it? Time on page, scroll depth, bounce, and whether they continue to another page.
- Action — does reading lead to a result? Goal completions such as signups, demo requests, downloads or purchases, and leads that later turn into customers.
The layers are a funnel, not a menu. A page with huge impressions and no reading is a headline that over-promises. A page that is read to the end but never leads anywhere is good writing without a next step. A page with modest traffic that turns readers into signups is often the most valuable page you have, and the one a traffic-only report ranks near the bottom.
That last point is the core of this article: if you only look at traffic, you overrate viral posts and underrate slow, specific pages that convert. The worked example below shows by how much. If you need the full list of individual metrics for each layer, it is in content performance metrics; this article is about how to combine them into decisions.
The table below maps each layer to the question it answers, the metrics to use and where the data comes from.
| Layer | Question | Metrics | Data source | Misleading on its own because |
|---|---|---|---|---|
| Seen | Does the content show up where readers look? | Impressions, clicks, CTR, average position; visits by channel | Search Console or Bing Webmaster; source and UTM reports | High impressions can come from a headline that over-promises |
| Read | Do visitors actually consume it? | Scroll reach, time on page, bounce, onward pageviews | Page reports, scroll tracking | Time on page counts open tabs; scroll alone ignores skimming |
| Action | Does reading lead to a result? | Goal conversions per 1,000 sessions, first-touch credit, leads | Goals, attribution | A small page can have a high rate on tiny volume |
Read the three layers together; each pattern of high and low values points to a different fix.
How do you set up tracking for content?
Most content analytics fails at setup, not at analysis. Five things need to be in place before the numbers mean anything.
Group your content by URL. If every article lives under /blog/ and every guide under /guides/, you can report on each group with a path prefix instead of tagging pages by hand. Add a second level when it helps, such as /blog/tutorials/ versus /blog/news/, so you can compare formats.
Define the actions as goals. Pick the two or three outcomes content is supposed to drive: signup, demo request, newsletter subscription, a key download. Make each a goal on an event or a thank-you page. Without goals, the action layer is empty and you are back to judging content on traffic.
Tag every link you distribute. When you share an article in a newsletter, on social or in a partner's post, add UTM parameters. Google's URL builder guidance says to always use utm_source, utm_medium and utm_campaign. Untagged newsletter clicks often show up as direct traffic, which makes email look useless and direct look miraculous.
Turn on scroll tracking. Time on page alone is a weak reading signal: a tab left open counts as reading. Scroll reach — the share of visits that got to 25%, 50%, 75% of the page — tells you where readers stop. Setup in TapCub is covered in track scroll depth.
Keep bots out of the denominator. Crawlers and AI bots read content too, sometimes in large numbers. If they sit in your visit count, every per-visit rate drops and pages popular with crawlers look worse than they are.
Worked example: why traffic alone misranks two articles
Sample data: two articles on a B2B SaaS blog, 90 days.
Article A is a broad listicle that took off in search. Article B is a narrow how-to about a problem your product solves.
Seen layer:
- A: 600,000 impressions, 18,000 search clicks, CTR 18,000 ÷ 600,000 = 3.0%, average position 4.1. Total sessions from all channels: 20,000.
- B: 90,000 impressions, 2,250 search clicks, CTR 2,250 ÷ 90,000 = 2.5%, average position 7.8. Total sessions: 2,500.
Search Console's performance report defines CTR as clicks divided by impressions and position as the average position of your topmost result, so these are the numbers you would see there. On a traffic report, A wins by a factor of eight: B has 2,500 ÷ 20,000 = 12.5% of A's sessions.
Read layer:
- A: 22% of visits reach 75% scroll depth, so 20,000 × 22% = 4,400 visits read most of it.
- B: 48% reach 75%, so 2,500 × 48% = 1,200 visits.
A still has more readers in absolute terms, but less than a quarter of its visitors read it through.
Action layer (signups in the same session the visitor entered on the article):
- A: 40 signups, 40 ÷ 20,000 = 0.20%, or 2 signups per 1,000 sessions.
- B: 75 signups, 75 ÷ 2,500 = 3.0%, or 30 signups per 1,000 sessions.
B produced 75 ÷ 40 = 1.875 times as many signups as A with one-eighth of the traffic. Per 1,000 sessions it converts 15 times better (30 ÷ 2). A report sorted by sessions puts A at the top and B far down the list; a report sorted by signups reverses the order.
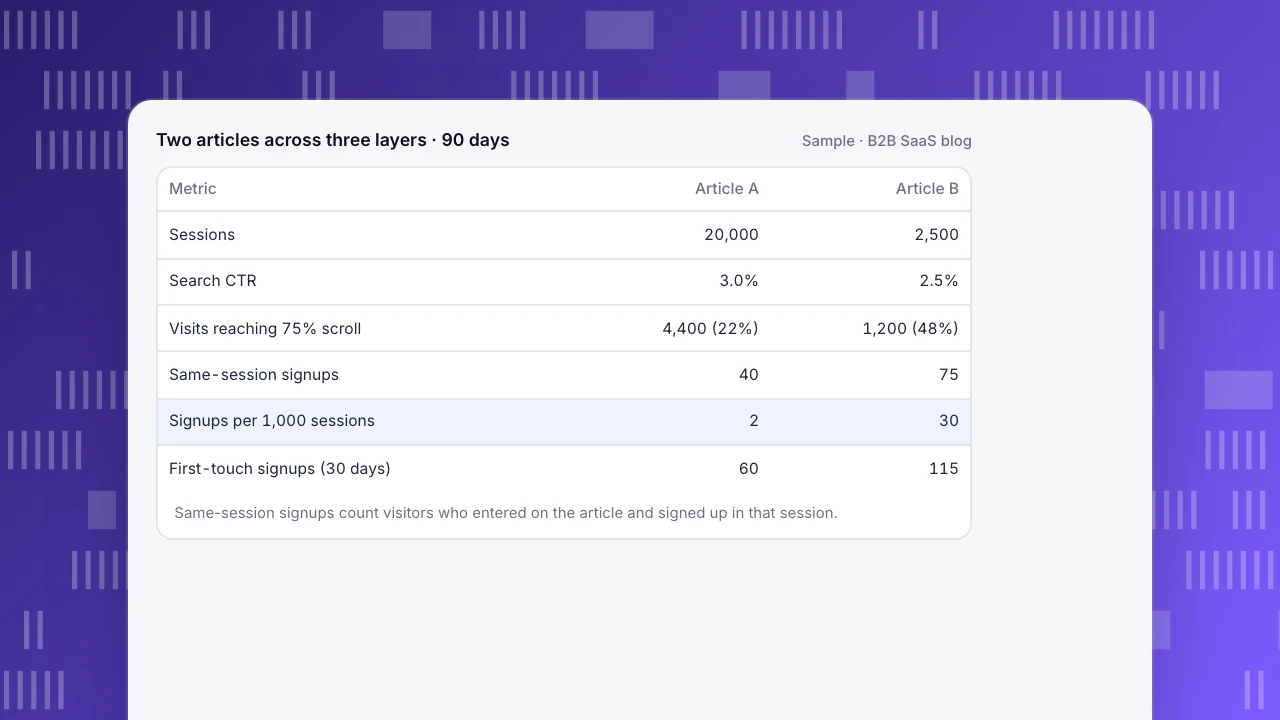
Neither article is useless. A builds awareness and earns links; B turns intent into customers. The decision changes, though. More budget for "articles like A" buys traffic; more budget for "articles like B" buys signups. The table after this section lays both articles side by side.
Two articles across three layers · 90 days
Sample · B2B SaaS blog| Metric | Article A | Article B |
|---|---|---|
| Sessions | 20,000 | 2,500 |
| Search CTR | 3.0% | 2.5% |
| Visits reaching 75% scroll | 4,400 (22%) | 1,200 (48%) |
| Same-session signups | 40 | 75 |
| Signups per 1,000 sessions | 2 | 30 |
| First-touch signups (30 days) | 60 | 115 |
Same-session signups count visitors who entered on the article and signed up in that session.
How do you credit content that converts later?
The action numbers above only count signups in the same session. Content often works more slowly: a reader finds your how-to, leaves, and signs up a week later after searching your brand name. Same-session counting gives that signup to brand search or direct, and the article gets nothing.
To see the delayed effect, use attribution with the landing page as the touchpoint and a lookback window of around 30 days, then compare first-touch and last-touch credit:
- Article A: 40 same-session signups; first-touch credit within 30 days: 60, or 60 ÷ 20,000 = 0.30% of its sessions.
- Article B: 75 same-session signups; first-touch credit: 115, or 115 ÷ 2,500 = 4.6%.
Both articles start more journeys than they finish, and B still leads by a wide margin. The gap between first-touch and same-session credit tells you what kind of page you have. A large gap means the page starts journeys that other pages close — cutting it because its last-touch numbers look small would remove the first step for future customers. Multi-touch models such as linear or position-based spread the credit further; neither proves the article caused the signup, but comparing them shows which pages consistently appear early in converting paths.
How often should you report content performance?
Content moves slowly, so most reviews should be monthly or quarterly. Weekly checks are for catching breakage, not for judging articles.
| Cadence | What to look at | What to decide |
|---|---|---|
| Weekly | Sudden drops in clicks or sessions for top pages, tracking errors, broken goals | Fix tracking or technical issues; no content judgments |
| Monthly | Three-layer table for new and top pages: impressions, CTR, scroll reach, goal conversions | Which new pieces to promote, which titles and descriptions to rewrite |
| Quarterly | Conversion and first-touch credit by content group, decaying pages, pages with zero actions | Topic mix for next quarter, which pages to update, merge or retire |
A new article usually needs weeks to settle in search, so give it at least one full month before comparing it with established pages. When you build the monthly report, start with the question the report answers, not with every chart you can export; structure is covered in how to write a data analysis report. Search-side KPIs for the SEO part of the program are in SEO KPIs.
What should you do with each pattern?
Once the three layers sit side by side, most pages fall into one of five patterns, each with a different fix:
- Seen, not clicked (high impressions, low CTR for its position): rewrite the title and meta description to match what searchers want. Pages ranking in the top 10 with below-median CTR are the cheapest wins.
- Clicked, not read (low scroll reach, high bounce): the page does not deliver what the title promised, or the answer is buried. Move the answer up, cut the preamble.
- Read, no action (good scroll reach, near-zero goals): add a relevant next step — a template, a demo link, a related guide — where readers finish, not only in the footer.
- Converting but small (like Article B): grow its reach with internal links from high-traffic pages, updated examples and distribution.
- Declining (a page that used to perform and is now losing clicks): find out why before you rewrite. Diagnosis is in content decay.
Run a full inventory against these patterns once or twice a year; the process for that is a content audit.
What are the most common content analytics mistakes?
- Ranking content by pageviews alone. As the example shows, it can invert the true order of value by a factor of 15 per visit.
- Counting only same-session conversions. Pages that start journeys look worthless. Check first-touch credit before cutting anything.
- Leaving distribution links untagged. Newsletter and social traffic slips into direct, and you underinvest in the channels that work.
- Treating time on page as reading. Pair it with scroll reach; one signal alone is easy to fool.
- Judging new pages too early. A two-week-old article competing with a two-year-old one will lose on every metric.
- Mixing bots with readers. Per-visit rates drop and crawler-heavy pages look worse than they are.
How to measure content marketing in TapCub
Here is the two-article example in TapCub, layer by layer:
- Seen. Connect Google Search Console or Bing Webmaster in Monitoring › Search performance to get clicks, impressions, CTR and average position by page and query. Pages in the top 10 with CTR below the median are marked as the ones where a new title and description pay off first. Search data is usually 1 to 3 days behind.
- Read. Web analytics › Pages shows time on page, bounce and downstream pageviews (how much reading a page sends onward), and its entry pages tab shows which articles start sessions. Turn on Scroll depth in the autocapture card (Pro plan and above) and All-platform analytics › Behavior › Heatmaps shows the average maximum scroll depth per page and a scroll reach chart, the 22% vs 48% comparison above.
- Action. In Web analytics › Goals, create the signup goal on an event, or a page goal with a prefix such as
/blog/to treat a section as a group. Select the goal and break it down by entry page to see which articles visitors entered on before converting. Note that the goal conversion rate here divides by unique visitors, not sessions, so it will differ slightly from a per-session figure. - Credit. In All-platform analytics › Behavior › Behavior analysis, run attribution with landing page as the touch dimension and the default 30-day lookback, and select first touch and last touch together so each becomes a column. That is where Article B's 115 first-touch signups versus 75 same-session signups show up.
- Keep the denominators clean. Bots and AI crawlers are counted separately in Web analytics › Bots, so the scroll and conversion rates above are based on human visits only.
FAQ
What is content marketing analytics?
Content marketing analytics measures whether content is seen, read and acted on, and uses the results to decide what to create, update or retire. It combines search data (impressions, clicks, position), engagement data (time on page, scroll depth) and conversion data (goals, leads). The point is to judge each page on all three layers, because traffic alone often ranks the wrong pages at the top.
How do you measure content marketing success?
Define two or three goals that content should drive, such as signups or demo requests, then report each page on three layers: search visibility, reading depth, and goal conversions per 1,000 sessions. Add first-touch attribution to credit pages that start journeys. Compare pages within the same content group and age, and review monthly rather than weekly.
What should a content marketing report include?
A content report should show the three layers side by side for new and top pages: impressions and CTR, scroll reach or time on page, and goal conversions. Add first-touch credit by content group, a list of decaying pages, and the decisions taken — what to promote, rewrite, merge or retire. Keep it to the questions the team will act on.
Which metric matters most for content marketing?
No single metric is enough, which is the main lesson of content analytics. If one number must lead, use goal conversions per 1,000 sessions, because it connects content to the business and does not reward traffic for its own sake. Always read it next to reach: a high rate on a page nobody sees is a reason to promote that page.
How long before you can judge a new piece of content?
Give a new article at least a month before comparing it with established pages, and longer for competitive search topics, since rankings usually take weeks to settle. During that time, check that it is indexed, getting impressions and being read. Judge conversions only once it has a few hundred sessions, so that a handful of signups does not decide its fate.
See also: News analytics for publishers: six metrics that matter more than pageviews.
See also: Mobile Content Marketing: How to Measure Load, Reading and Return.
See also: SaaS Content Marketing Strategy: Write for Problems Your Product Solves.
See also: Content Metrics: Which Numbers to Use for Which Purpose.
See also: Content Planning: From Reader Questions to a Calendar You Can Finish.
Sources
- Google Search Console Help. Performance report (Search results) — definitions of clicks, impressions, CTR and average position. Verified 2026-11-15.
- Google Analytics Help. URL builders: Collect campaign data with custom URLs — required UTM parameters. Verified 2026-11-15.
Was this article helpful?
We use your answers to fix and expand this page.
Couldn’t send. Please try again in a minute.
Thanks for the feedback. We’ll use it to improve this page.You’ve already sent feedback on this page. Thanks.

Customer Experience Consultant
Writes about live chat, visitor conversations, and self-service, sharing practical ways to make customer communication clearer and more effective.