Try it on your own data
Every report in this article is in the free plan. One snippet for web and apps, up to 10 sites.
Start freeTo reduce checkout abandonment, split checkout into steps and find the one where shoppers leave, then match it to a cause. Leaving after starting checkout is not the same as abandoning a cart: it is usually an unexpected cost, a forced account or a failed payment, and each leaves a different signal in the funnel.
What you will learn
- Checkout abandonment = 1 − orders ÷ checkouts started; do not compare it with cart abandonment benchmarks
- A steep drop where costs appear, at the account step, or after payment points to three different causes
- Estimate each fix in orders: in the sample, showing shipping early is worth +120 orders, guest checkout +61
Checkout abandonment vs cart abandonment
Checkout abandonment happens when a shopper starts checkout and leaves before the order is confirmed. Cart abandonment is wider: it counts everyone who added something to a cart and did not buy, including people who never clicked the checkout button. The two numbers answer different questions, so mixing them up sends you to the wrong fix.
A shopper who adds a jacket to the cart and closes the tab may simply be saving it for later. A shopper who types an email and address and then leaves has decided to buy and hit something on the way. That something is usually one of three things: a cost they did not expect, a demand to create an account, or a payment that failed. Each one leaves a different trace in your data, which is why the fix starts with a funnel split by checkout step, not with a list of generic tips.
The definition of the wider metric and its formula are on the cart abandonment rate page. This article stays inside checkout.
How to calculate the checkout abandonment rate
The formula is short:
Checkout abandonment rate = 1 − orders ÷ checkouts started
Sample data: in one month a store sees 5,000 carts, 2,000 checkouts started and 837 orders.
- Checkout abandonment rate = 1 − 837 ÷ 2,000 = 58.2%
- Cart abandonment rate = 1 − 837 ÷ 5,000 = 83.3%
Same store, same month, a 25-point difference. If you compare your checkout figure with a cart abandonment benchmark, you will think checkout is fine when it is not, or the reverse. Baymard Institute's average of 50 studies puts cart abandonment at 70.22%; there is no equally well-sourced average for checkout alone, so the useful comparison is your own store over time and between segments.
Two counting choices change the result, so write them down once and keep them:
- Sessions or people. Counting people over a 7-day window lets a shopper who leaves on Monday and pays on Wednesday count as a success. Counting sessions treats Monday as an abandonment.
- What "started" means. Pick one event, such as the first view of the checkout page, and do not switch to "clicked the checkout button" halfway through the year.
To try different numbers quickly, use the cart abandonment calculator.
Why customers abandon checkout
Baymard Institute surveyed US online shoppers who had abandoned an order during checkout (people who said they were just browsing are excluded). The table lists the reasons it reports, the signal each one leaves in your analytics, and the usual fix. The shares add up to more than 100%, so read each one as the share of shoppers who mentioned that reason.
Read the table as a map from symptom to cause. The survey tells you what is common across stores. Your funnel tells you which reason applies to yours. A store with free shipping will not lose 40% of checkouts to extra costs; it might lose them to a declined card instead.
| Reason (Baymard, US) | Share | Signal in your data | Usual fix |
|---|---|---|---|
| Extra costs too high | 40% | Steep drop on the step where shipping or tax appears | Show costs on the product page or cart |
| Delivery too slow | 20% | Drop at shipping method; exits to the delivery FAQ | Show delivery dates before checkout |
| Didn't trust the site with card details | 19% | Long time and exits at payment entry | Trust signals and known payment brands next to the pay button |
| Site wanted an account | 18% | Long time at the contact step; sign-in and forgot-password clicks | Guest checkout; create the account after payment |
| Checkout too long or complicated | 17% | Small losses on every step and long median times | Fewer fields, prefilled billing address |
| Website errors or crashes | 17% | Payment submitted but no order; errors on checkout pages | Fix and monitor errors on checkout pages |
| Returns policy not satisfactory | 13% | Paths from checkout to the returns page | Summarise the policy near the total |
| Couldn't see total cost up front | 12% | Paths from cart to the shipping policy page | Estimated total in the cart |
| Credit card declined | 10% | Repeated payment attempts with no order | Clear retry message and a second method |
| Not enough payment methods | 9% | Drop at payment for one country or device | Add wallets and local methods |
Shares from Baymard Institute's survey of US shoppers who abandoned during checkout (excluding 'just browsing'); they add up to more than 100%.
Split the funnel by checkout step
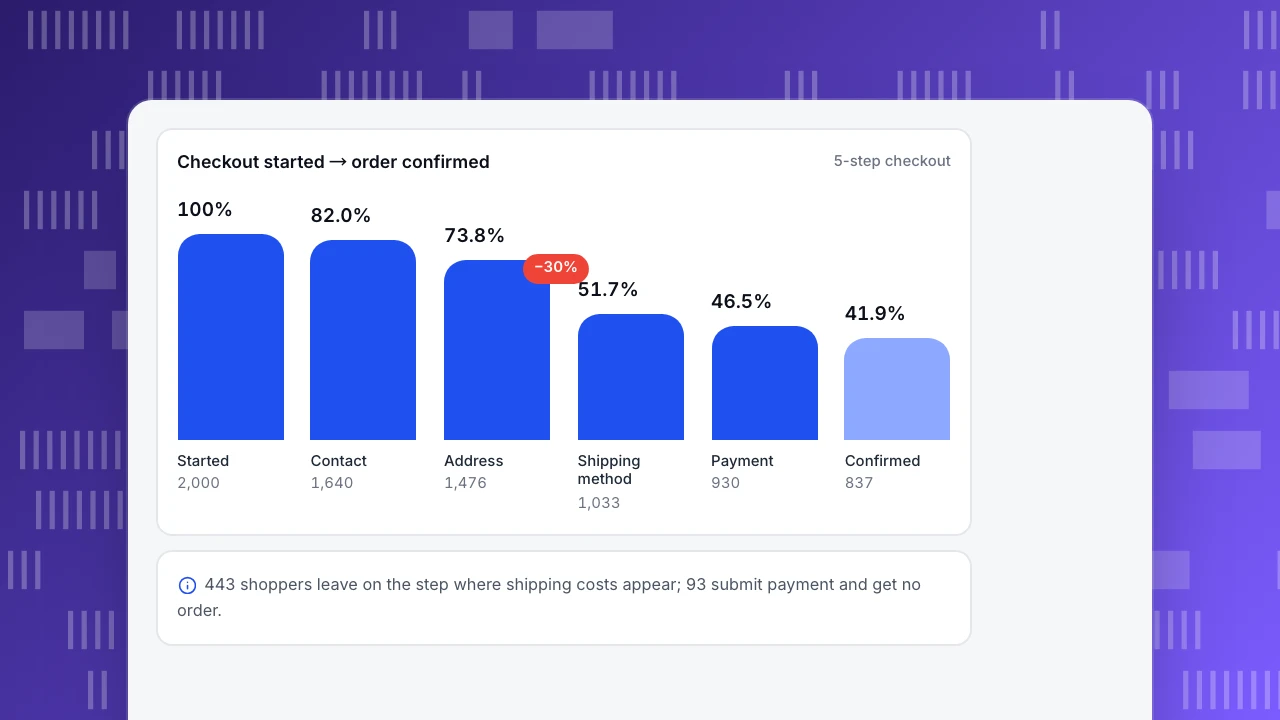
Sample data: the 2,000 checkouts from above, in a five-step checkout.
| Step | Shoppers | Rate from previous step | Lost at this step |
|---|---|---|---|
| Checkout started | 2,000 | — | — |
| Contact (email, account or guest) | 1,640 | 82.0% | 360 |
| Shipping address | 1,476 | 90.0% | 164 |
| Shipping method (costs shown) | 1,033 | 70.0% | 443 |
| Payment submitted | 930 | 90.0% | 103 |
| Order confirmed | 837 | 90.0% | 93 |
Overall, 837 ÷ 2,000 = 41.85% of checkouts become orders; the other 58.15% is the abandonment rate calculated above. But the losses are not spread evenly:
- Shipping method: 443 lost, a 30% drop. This is the step where shipping costs and delivery dates appear. A steep drop right after a price is revealed is the clearest signal of unexpected costs.
- Contact: 360 lost, an 18% drop. If this step asks shoppers to create an account or sign in before they can continue, forced registration is the likely cause.
- Order confirmed: 93 lost after submitting payment. These shoppers pressed pay and did not get an order. That is payment failure: declined cards, 3-D Secure challenges that time out, or errors.
The address and payment-entry steps each lose about 10%, which is roughly what typing a form costs. Fixing them is worth doing, but they are not where this store bleeds.
Checkout started → order confirmed
5-step checkoutStarted
2,000
Contact
1,640
Address
1,476
Shipping method
1,033
Payment
930
Confirmed
837
What each step's signal tells you
Use one rule per step to pick the most likely cause before you change anything:
- If shoppers leave right after a price changes, look at extra costs first. Check how many went from the shipping step to your shipping policy page or back to the cart.
- If the contact step has a long median time and many exits, look at account creation. Count how many clicked "sign in" or "forgot password" during checkout.
- If many shoppers submit payment but no order follows, look at payment errors. Group errors on the payment page by message and browser. A spike after a release points to your code; a steady rate on one card type points to the payment provider.
- If one device is far worse at the same step, look at the form on that device. Missing autofill, a keyboard that covers the button, or a wallet that is not offered on mobile are common causes.
- If the drop is limited to one country, check local payment methods and shipping rules for that country.
Session replays help confirm a cause once the numbers have pointed to a step. Watch ten sessions that dropped at that step rather than a hundred random ones, and keep payment fields masked.
Fix the biggest leak first
Estimate each fix in orders before choosing. Using the sample funnel and changing one step at a time:
| Fix | Step it affects | Change assumed | Orders after | Extra orders |
|---|---|---|---|---|
| Show shipping cost on the product page and cart | Shipping method | 70% → 80% | 957 | +120 |
| Offer guest checkout, create the account after payment | Contact | 82% → 88% | 898 | +61 |
| Fix the top payment errors, add a second payment method | Order confirmed | 90% → 95% | 884 | +47 |
The arithmetic for the first row: 1,476 × 80% ≈ 1,181 reach payment entry, × 90% ≈ 1,063 submit payment, × 90% ≈ 957 orders, which is 120 more than 837. The assumed improvements are illustrations, not promises. Plug in your own.
Beyond these three, the changes that usually pay back:
- Ask for fewer fields. Baymard's benchmark of US checkouts found an average of 23.48 form elements shown by default, and estimates an ideal flow can use 12–14. Cut the second address line, the company field and the separate billing address unless a shopper needs them.
- Do not ask twice. WCAG 2.2 success criterion 3.3.7 (Redundant Entry) asks that information a user already entered in the same process is filled in or selectable. "Billing address same as shipping" should be the default.
- Show the total early. "Couldn't see or calculate total order cost up front" is a separate reason in Baymard's list (12%). An estimated total in the cart helps.
- Offer wallets on mobile. Typing a card number on a phone is slow. Wallet buttons skip most of the form.
- Keep trust signals near the pay button. Returns policy, security and contact details belong at the decision point, not in the footer.
For conversion rate benchmarks and broader levers, see ecommerce conversion rate. For the steps before checkout, see the ecommerce funnel guide and the ecommerce customer journey.
Check that the fix worked
Abandonment moves with seasons, promotions and traffic mix, so a lower rate the week after a change proves little on its own. Three habits make the comparison fair:
- Compare the step you changed, not only the total. If you moved shipping costs onto the product page, the shipping step's pass rate should rise. If the total improved but that step did not, something else caused it.
- Use equal periods and similar traffic. Four weeks before against four weeks after, with the same campaigns running, beats one week against one week. Mark the change date on your charts.
- Wait for enough orders. With 800 orders a month, a three-point change in a step rate is a few dozen orders and can be noise. A proper A/B test splits traffic at random and answers the question faster; most store platforms and testing tools can run one.
How to find checkout leaks in TapCub
Take the five-step checkout above and work through it in TapCub.
- Build the checkout funnel. In All-platform analytics › Behavior › Behavior analysis, add a funnel with your checkout events as steps, from checkout started to order confirmed, with a short window such as one day. Each step shows its count, the rate versus the previous step, the drop-off and the median time from the previous step. The largest drop is marked, which in the sample is the shipping step. Break it down by device or country, and click a step to see who dropped there. If your checkout is one page, send a
tapcub.trackevent as each section is completed. Read funnel drop-off explains each number. - Count form submissions without capturing what people type. With
data-forms="true"on the script, form submissions appear in Web analytics › Events with the form's id, name and action only, never the values entered. That is enough to see which checkout form is submitted less often. Setup: track form submissions. - Look for payment errors. Monitoring › Errors shows the error count, the error rate (errors ÷ pageviews), affected visitors and sessions, and each error group with its pages, devices and last occurrence. A group that appears only on the payment page is a strong lead for the 93 shoppers who paid without getting an order (find JavaScript errors). To be told when it spikes, create a monitor on
error_ratein All-platform analytics › Operations › Monitors; it notifies but does not change anything. - Watch a few sessions, with care. Session replay in All-platform analytics › Behavior › Session replay is off by default. When an admin turns it on, input values are masked by default, password fields are never recorded, and the confirmation asks you to put pages with payment forms on the excluded paths. Exclude the card-entry step and replay the steps before it.
- Offer help where shoppers hesitate. Live chat › Chat settings › Proactive invites can open a message on the shipping step after a set number of seconds. Live chat › Reports › Conversion attribution then compares goal conversion for visitors who chatted and those who did not.
TapCub measures checkout; it does not run A/B tests or send abandoned-checkout emails. Use your store platform for both, and come back to the funnel to see whether the step moved.
FAQ
What is the difference between cart abandonment and checkout abandonment?
Cart abandonment counts everyone who added an item to the cart and did not buy. Checkout abandonment counts only shoppers who started checkout and left before the order was confirmed. Checkout abandonment is a narrower group with stronger intent, and its causes, such as surprise costs, forced accounts and payment failures, are usually easier to find and fix.
What is a good checkout abandonment rate?
There is no well-sourced industry benchmark for checkout alone. Baymard's widely cited 70.22% average is for cart abandonment, which is a different metric. Compare your checkout rate with your own past months and between devices and countries. A gap of more than 15 points at one step usually points to a fixable problem.
Why do customers abandon checkout?
In Baymard's survey of US shoppers who abandoned during checkout, the most common reasons were extra costs that were too high, slow delivery, not trusting the site with card details, being asked to create an account, a long or complicated checkout and website errors. Your own step funnel shows which of these applies to your store.
How do you reduce checkout abandonment?
Split your funnel by checkout step and fix the step with the steepest drop first. Show shipping costs before checkout, offer guest checkout, cut optional fields, prefill billing from shipping and fix payment errors. Estimate each fix in extra orders, make one change at a time, and compare the same step before and after.
Do abandoned-checkout emails work?
They can recover some orders, because the shopper already chose items and often entered an email. They do not fix the cause, though. If 30% of shoppers leave when shipping costs appear, a reminder email brings back a few of them to the same surprise. Fix the step first, then use reminders for the rest.
See also: Return Policy Template: Copy-Paste Return and Shipping Policies for Ecommerce.
Sources
- Baymard Institute, Cart Abandonment Rate Statistics (average of 50 studies; reasons for abandonment during checkout, US shoppers; checkout form elements benchmark). Checked 2026-11-15.
- Baymard Institute, Checkout Usability research. Checked 2026-11-15.
- W3C, Understanding Success Criterion 3.3.7: Redundant Entry, WCAG 2.2. Checked 2026-11-15.
Was this article helpful?
We use your answers to fix and expand this page.
Couldn’t send. Please try again in a minute.
Thanks for the feedback. We’ll use it to improve this page.You’ve already sent feedback on this page. Thanks.

Data Engineer
Writes about event design, data quality, and collection workflows, with verifiable implementation methods for reliable analytics.