Try it on your own data
Every report in this article is in the free plan. One snippet for web and apps, up to 10 sites.
Start freeThe ecommerce customer journey is the path a shopper takes from the first visit through product pages, cart, checkout, delivery and the next order. To improve it, turn each stage into a funnel step. The most expensive leak is usually after add to cart, not on the homepage, and it only shows when you split each step by device.
What you will learn
- Give every stage one countable event and read step conversion and median time together
- Big drops at the top are normal; compare each step with the segment that does it well
- In the sample, mobile matching desktop at checkout is worth 99 orders, five times any earlier step
What is the ecommerce customer journey?
The ecommerce customer journey is every step a shopper takes with an online store, from the first visit to the purchase and, if things go well, the next purchase. Most guides split it into five or six stages: discovery, consideration, cart, checkout, delivery and repeat. Real shoppers do not move through them in a straight line. They compare, leave, come back from an email, add to cart on mobile and pay on a laptop.
This guide is about the analytics side: which events describe each stage, how to read a funnel built from them, and how to decide what to fix first. If you need the workshop method for drawing a journey map with personas and emotions, read how to build a customer journey map. The map tells you what shoppers feel. The funnel tells you how many of them got stuck, where, and for how long.
The argument of this article fits in one sentence. The most expensive leak in an online store is usually after add to cart, not on the homepage, and you only see it when the funnel shows conversion and time for each step, split by device and source.
The stages, and what each one must answer
Each stage exists because the shopper has a question. If the page does not answer it, they leave. The table pairs each stage with the event that marks it and the leak that shows up most often.
Three rules make the table usable:
- One stage, one event. A stage you cannot count is a stage you cannot fix. "Consideration" becomes
view_itemon a product page; "checkout" becomesbegin_checkout. - Count in sessions and in people. A session funnel shows friction inside one visit. A people funnel with a longer window shows shoppers who come back days later to finish.
- Keep the stages in buying order. Delivery and repeat purchase are part of the journey even though they happen after the money has moved. A store that ignores them is buying every customer twice.
| Stage | Shopper's question | Key event | Common leak |
|---|---|---|---|
| Discovery | Is this store worth a look? | Page view, landing page | Ad promises something the landing page does not show |
| Consideration | Is this the right product? | Product view | Missing sizes, photos or delivery date |
| Cart | What will it cost in total? | Add to cart | Shipping cost hidden until checkout |
| Checkout | Is paying here quick and safe? | Checkout started, each checkout step, purchase | Forced account, long form, payment errors |
| Delivery | Where is my order? | Order status view, support contact | No proactive shipping updates |
| Repeat | Why come back? | Second purchase | Reminders sent at the wrong time |
Use one event per stage so each move between stages can be counted.
How to build the journey from data
Workshops produce a journey everyone agrees with. Data shows the journey shoppers actually took. You need both, but the data version has to come first if the goal is to fix something this quarter.
- List the events. At minimum: page view, product view, add to cart, checkout started, each checkout step (contact, shipping, payment), purchase. Send the purchase from your server so the amount and order ID are reliable, because a browser can close before a client-side event is sent.
- Build the funnel. Put the events in order with a conversion window. Seven days suits most stores; furniture or electronics with long comparison cycles may need 30.
- Read conversion and time together. A step that loses many people quickly usually has a hard blocker (a surprise cost, an error). A step that loses people slowly usually confuses them (a long form, unclear shipping options).
- Check the paths. For the people who dropped at a step, see where they went instead. Shoppers who leave the cart for the shipping policy page are telling you what was missing.
- Split by device, source and landing page. Averages hide the leak. The worked example below shows how.
For a fuller treatment of the funnel itself, including how to set the steps for a typical store, see the ecommerce funnel guide. Broader store metrics such as revenue per visitor are covered in ecommerce analytics.
A worked funnel: where 10,000 sessions go
Sample data: one month for a store with an average order value of $72.
| Step | Sessions | Rate from previous step | Lost at this step | Median time from previous step |
|---|---|---|---|---|
| Landed | 10,000 | — | — | — |
| Viewed a product | 5,800 | 58.0% | 4,200 | 0:35 |
| Added to cart | 1,160 | 20.0% | 4,640 | 2:40 |
| Started checkout | 580 | 50.0% | 580 | 1:50 |
| Purchased | 290 | 50.0% | 290 | 4:20 |
Overall conversion is 290 ÷ 10,000 = 2.9%. The cart abandonment rate is 1 − 290 ÷ 1,160 = 75.0%. That is close to the 70.22% average Baymard Institute calculates across 50 published studies, so on the headline number alone this store looks normal. The 870 abandoned carts hold 870 × $72 = $62,640 of products that shoppers had already chosen.
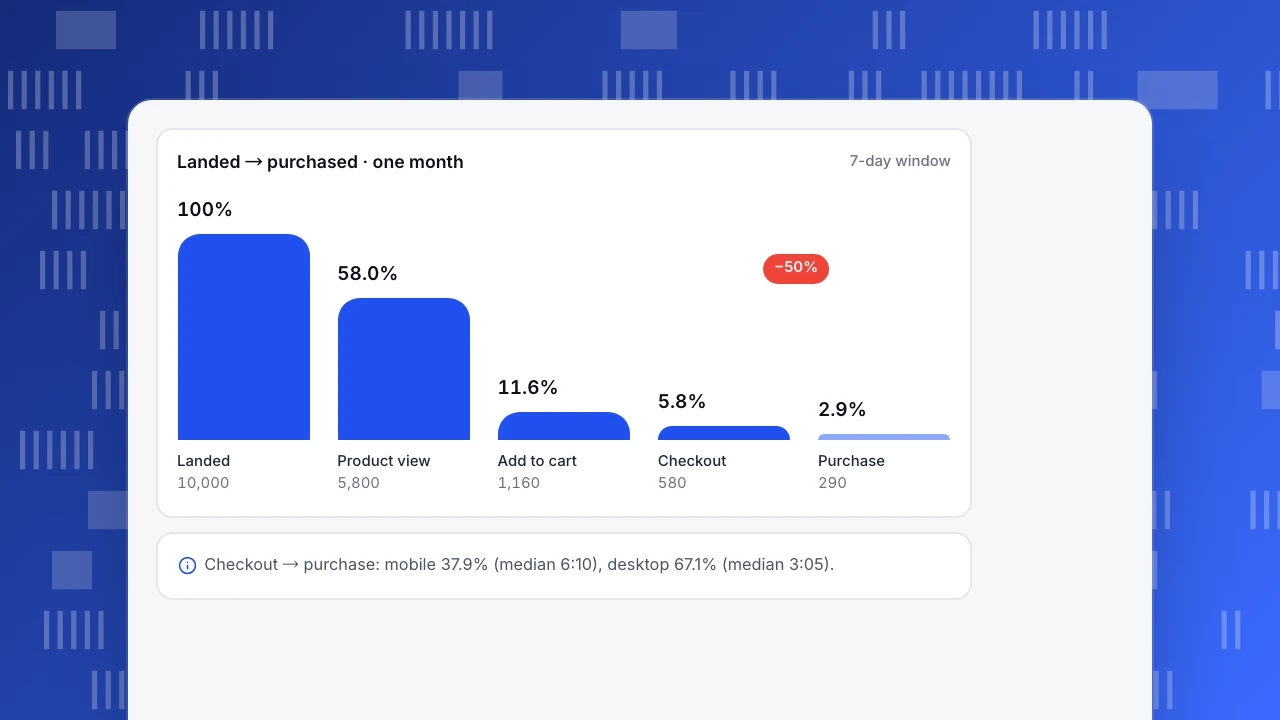
Looking only at the "lost" column, the biggest leaks seem to be the first two steps: 4,200 and 4,640 sessions. That is the trap. Most people who land on a store are browsing, and most people who view a product were never going to buy that day. Large drops at the top are normal. To find the leak that is abnormal, compare each step against the segment that does it well.
Landed → purchased · one month
7-day windowLanded
10,000
Product view
5,800
Add to cart
1,160
Checkout
580
Purchase
290
Why the expensive leak is usually after add to cart
Split the same month by device. Sample data again; the totals match the table above.
| Step | Mobile (6,500 sessions) | Desktop (3,500 sessions) |
|---|---|---|
| Landed → product view | 3,770 (58.0%) | 2,030 (58.0%) |
| Product view → cart | 717 (19.0%) | 443 (21.8%) |
| Cart → checkout | 340 (47.4%) | 240 (54.2%) |
| Checkout → purchase | 129 (37.9%) | 161 (67.1%) |
| Median checkout time | 6:10 | 3:05 |
Now ask a concrete question for each step: if mobile matched desktop here, with every other step unchanged, how many extra orders would there be?
- Product view → cart: 3,770 × 21.8% ≈ 822 carts instead of 717, so 105 more carts. Mobile carts convert at 129 ÷ 717 = 18.0%, which gives about 19 extra orders.
- Cart → checkout: 717 × 54.2% ≈ 389 checkouts instead of 340, so 49 more. Mobile checkouts convert at 37.9%, which gives about 19 extra orders.
- Checkout → purchase: 340 × 67.1% ≈ 228 orders instead of 129, so 99 extra orders.
The checkout step is worth five times either of the other two. Ninety-nine orders is a 34.2% increase on 290, or 99 × $72 = $7,128 a month. To get the same 99 extra orders from the top of the funnel you would need the landing-to-product rate to climb from 58.0% to 77.8%, a much harder change to make on a homepage.
The median time agrees. Mobile shoppers spend twice as long in checkout and still fail more often. That pattern points to a form or payment problem, not a lack of interest: these people chose a product, put it in the cart and started paying.
This is why the stage after add to cart deserves the first look in most stores. The shoppers have shown intent, the causes are concrete, and the gap between segments is usually wide. Baymard's survey of US shoppers who abandoned during checkout lists extra costs that were too high (40%), a required account (18%), a checkout that was too long or complicated (17%) and website errors (17%) among the main reasons. Each one leaves a signal you can find. The checkout steps are covered in depth in how to reduce checkout abandonment.
Break it down by device, source and landing page
Device was the useful cut in the example. Others to try, in this order:
- Device. Mobile and desktop differ in screen size, autofill, wallets and patience. A gap of more than 15 points at the same step is worth a session-level look.
- Traffic source. Paid social often brings impulse visitors who view one product and leave; search brings people who already know what they want. A low product-to-cart rate for social traffic may be a targeting question, not a page question.
- Landing page. Visitors who land on a product page skip the homepage entirely. If most revenue starts on product pages, homepage redesigns will move little.
- New vs returning. Returning visitors usually convert better. If a step converts worse for returning visitors, something changed on that step since their last visit, such as a new shipping rule.
- Country. Shipping costs, delivery times and payment methods change by country. A checkout drop limited to one country is often a missing local payment method.
Keep the rule simple: if one segment converts far worse at one step, start there; if every segment is low at the same step, the step itself is broken.
Fix in priority order
Turn each leak into an estimate before you choose. Extra orders × average order value gives a monthly value; divide by the effort and fix the highest ratio first.
| If you see… | It usually means… | Try first |
|---|---|---|
| Big drop from checkout to purchase on mobile only | Form or payment friction on small screens | Wallet payments, fewer fields, address autocomplete |
| Drop at the shipping step on every device | Surprise costs | Show shipping on the product page or cart |
| Long time and high exit on the account step | Forced registration | Guest checkout, create the account after payment |
| Paths from cart to the returns or shipping policy page | Missing information at the decision point | Summarise the policy next to the order total |
| Low product-to-cart only for one campaign | Wrong audience or wrong promise in the ad | Fix the ad or landing page, not the product page |
A chat widget can also help at the decision point, especially for questions about sizing, delivery dates or compatibility. Whether it actually raises conversion is something to measure, not assume; AI chatbots for ecommerce covers what automated answers can and cannot handle.
After the purchase: delivery, support and repeat orders
The journey does not end at the thank-you page. In the sample month, 58 of the 290 buyers ordered again within 90 days, a repeat rate of 58 ÷ 290 = 20.0%. Every point of repeat rate is worth as much as a point of first-time conversion and costs nothing in acquisition.
What to track after the order:
- Order status page views. Many views per order mean shoppers are anxious about delivery; proactive shipping updates reduce them.
- Support contacts per order. Group them by reason (where is my order, returns, damaged item) and fix the top reason in the product or the process.
- Time to second order. Use it to time reminders. If most repeat orders come between day 30 and day 45, a reminder on day 10 is too early.
- Lifetime value by first product or first channel. Some channels bring buyers who never come back. See LTV and average order value for the formulas.
How to map and fix the journey in TapCub
Here is the same 10,000-session example worked through in TapCub.
- Lay out the stages. In All-platform analytics › Business › Journey maps, create a journey with up to 20 stages, each defined by page patterns or events (for example
/products/*for product view,add_to_cart,begin_checkout,purchase). Each stage shows sessions that reached it and how many moved on to the next stage in the same session. For stages built on pages, it also shows the share of sessions with errors, rage clicks and exits. - Build the funnel with time. In All-platform analytics › Behavior › Behavior analysis, add a funnel with the same steps and a 7-day window. Each step shows its count, the rate versus the previous step, the drop-off and the median time from the previous step, and the largest drop is marked. Break it down by device to get the mobile and desktop columns from the example, then click the checkout step to list the people who dropped there. The step-by-step guide is in build a funnel.
- See where droppers went. Use paths in the same Behavior analysis area to see the pages that followed the cart for people who did not start checkout (analyze user paths). Bots are counted separately in Web analytics › Bots, so crawler visits do not inflate the landed count or deflate your conversion rate.
- Check whether chat helps at checkout. If you run TapCub live chat on the same script, Live chat › Reports › Conversion attribution compares the goal conversion of visitors who chatted with visitors who did not, and lists the pages where chats started. It is an observational comparison, and the report warns when fewer than 30 visitors chatted.
TapCub measures the journey; it does not run A/B tests or send cart recovery emails. Test changes in your store platform or testing tool, and compare the funnel before and after.
FAQ
What are the stages of the ecommerce customer journey?
Most stores use five or six: discovery, consideration (product pages), cart, checkout, delivery and repeat purchase. Give each stage one countable event, such as product view, add to cart, checkout started and purchase, so you can measure how many shoppers move from one stage to the next and how long each move takes.
How do you map an ecommerce customer journey with data?
List one event per stage, build a funnel in buying order with a conversion window, and read the rate and median time for each step. Then split the funnel by device, source and landing page. A step where one segment does far worse than another is usually the leak to fix first.
Where do most shoppers drop off?
The largest raw drops are at the top, because most visitors are browsing. The most expensive drop is usually after add to cart, when shoppers who chose a product leave during checkout. Baymard's research lists extra costs, required accounts, long checkouts and site errors among the main reasons.
What is the difference between a customer journey map and a funnel?
A journey map is a qualitative picture of what shoppers think, feel and do at each stage, usually built from interviews. A funnel is a quantitative count of how many people complete each step in order. Use the map to form ideas and the funnel to measure which leak is largest.
How long should a funnel conversion window be?
Seven days fits most stores, because most purchases happen within a few visits. For expensive or considered products, such as furniture or electronics, try 30 days and compare. If the conversion rate rises a lot with the longer window, many of your shoppers come back later to finish.
See also: Consumer behavior examples: eight behaviors and the trace each leaves in your data.
Sources
- Baymard Institute, Cart Abandonment Rate Statistics (average of 50 studies; reasons for abandonment during checkout). Checked 2026-11-15.
- Baymard Institute, Checkout Usability research. Checked 2026-11-15.
- Gibbons, S., Nielsen Norman Group, Journey Mapping 101. Checked 2026-11-15.
Was this article helpful?
We use your answers to fix and expand this page.
Couldn’t send. Please try again in a minute.
Thanks for the feedback. We’ll use it to improve this page.You’ve already sent feedback on this page. Thanks.

Product Analyst
Focuses on event analysis, conversion funnels, and retention, using clear metric definitions and structured analysis to explain product performance.