Try it on your own data
Every report in this article is in the free plan. One snippet for web and apps, up to 10 sites.
Start freeConsumer behavior examples are things shoppers do that you can find in data: comparing across several visits, buying on impulse, abandoning a cart, buying with a code, ordering again, switching shops, switching devices and arriving through a recommendation. Each one leaves a trace you can check, which is the point of listing them.
What you will learn
- Keep only examples where you can name the event, page or number that shows them
- In the sample, 36% of visitors (those with two or more sessions) produced 60% of orders; judging by same-session conversion misses them
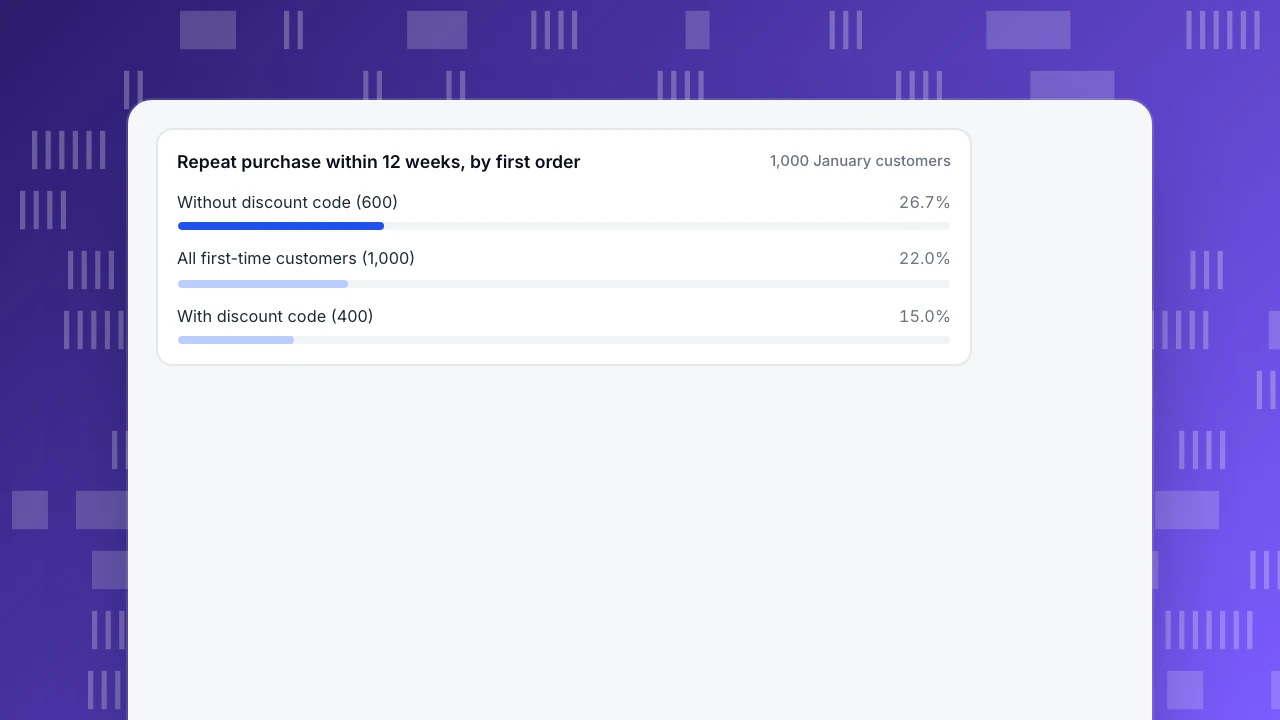
- A 22.0% repeat rate hid 15.0% for code-driven first orders and 26.7% for the rest; split before you average
What counts as a consumer behavior example
A consumer behavior example is something a shopper does that you can point at: they compare, hesitate, buy on a whim, come back, or tell a friend. Feelings and motives are harder to see, but every action leaves a trace in your data, and that trace is the useful part for anyone running a site or a shop.
That gives a simple test for any example you read elsewhere: can you name the event, page or number where it would show up? "Shoppers value social proof" is a theory. "Product pages with reviews get more add-to-carts than pages without" is a behavior you can check. This article keeps only the second kind, and it skips the psychology survey on purpose; the point is what to look for, not why the brain does it.
Two cautions before the examples. First, the numbers below are sample data, not benchmarks. Second, a behavior counted in your data is a group of visits, not a person's reasons. Treat each trace as a question to investigate, not a conclusion.
Eight consumer behaviors and the trace each one leaves
The table lists the behaviors that matter most for an online store or a subscription site, what each looks like in a real session, the signal in analytics, and where to look first.
Read the table as a map from behavior to report, not as a checklist. A store of 40 orders a month will not have enough data for the brand-switching row, and a software subscription has no cart. Pick the rows that match what you sell.
| Behavior | Signal in your data | Where to look |
|---|---|---|
| Comparison shopping | Buyers have more sessions and product views than non-buyers | Sessions per buyer; conversion by visit pattern |
| Impulse buying | Short time from first view to order; first-session orders | Time to purchase; first-session conversion |
| Cart abandonment | Add-to-cart without purchase; exits at cart or shipping step | Funnel by step |
| Price-triggered buying | Orders with a coupon; spikes on campaign days | Orders by coupon property; annotated chart |
| Repeat purchase | Same person ordering twice or more | Retention with order as start and return event |
| Brand or shop switching | Gap since last order far longer than the customer's usual gap | Lifecycle and recency |
| Channel switching | One person with sessions on two devices before an order | Person timeline; device split |
| Recommendation and referral | New referrers, AI sources, direct visits to deep pages | Sources report |
Pick the rows that match what you sell; a store with 40 orders a month lacks the data for brand switching.
Comparison shopping: many visits before one order
Google's research on how people shop describes a "messy middle" between the first trigger and the purchase, where shoppers loop between exploring options and evaluating them as often as they need. For a site, that loop shows up as a visitor who returns several times and views several products before buying.
Sample data: 5,000 visitors who viewed at least one product page in a month, split by how many sessions they used.
| Visit pattern | Visitors | Orders | Conversion |
|---|---|---|---|
| One session only | 3,200 | 96 | 3.0% |
| Two or more sessions | 1,800 | 144 | 8.0% |
| All | 5,000 | 240 | 4.8% |
The overall conversion rate is 240 ÷ 5,000 = 4.8%. The split shows more: 36% of the visitors (1,800 of 5,000) produced 60% of the orders (144 of 240). Shoppers who come back are not a leftover group; they are the main buyers.
What to do with it depends on the rule you apply:
- If most orders come from visitors on their second or later session, do not judge a campaign on same-session conversion alone. A first visit that did not buy may still be the one that started the purchase.
- If many returning visitors view the same two or three products, put those comparisons in one place, such as a comparison table or a short buying guide, instead of making shoppers open tabs.
- If returning shoppers arrive through direct or branded search, the first visit was probably the trigger and the return was the decision. Check your sources report before cutting spend on the channel that started it.
The same dataset can also mislead: a long consideration period inflates visits per buyer for expensive items. Compare like with like, such as products in one price band.
Repeat buying and what discounts do to it
Repeat purchase is the clearest trace of satisfaction that does not need a survey. It is also the behavior most easily distorted by how the first order was won.
Sample data: 1,000 customers placed their first order in January. 220 of them ordered again within 12 weeks. The repeat rate is 220 ÷ 1,000 = 22.0%. Split by whether the first order used a discount code:
| First order | Customers | Ordered again | Repeat rate |
|---|---|---|---|
| With discount code | 400 | 60 | 15.0% |
| Without code | 600 | 160 | 26.7% |
| All | 1,000 | 220 | 22.0% |
The two groups add up to the total: 60 + 160 = 220. The gap is 11.7 points. It does not prove that discounts cause lower loyalty, because people who wait for a code may already be different shoppers. It does show that the single 22% number hides two behaviors, and that a campaign which brought in 400 code-driven customers will produce fewer repeat orders than one which brought in 400 full-price customers.
Rules for reading it:
- Fix the window before you look. Twelve weeks here; if you compare 12 weeks for one group with 6 for another, the result is meaningless.
- Count customers, not orders. One customer with five orders should not lift the repeat rate by five.
- Wait for the window to close. January customers have a complete 12-week window only by late March.
- If a group is under about 30 customers, treat the rate as a hint, not a result.
Repeat rate has its own page in the glossary, repeat rate, and recency, frequency and spend together are covered under RFM.
Repeat purchase within 12 weeks, by first order
1,000 January customersAbandonment, impulse buying and switching devices
Three more behaviors are visible in short signals, and each has a rule that keeps you from over-reading it.
Cart abandonment. Baymard Institute's list of reasons shoppers give for leaving, which excludes shoppers who were just browsing, puts extra costs first at 40%, then slow delivery at 20%, distrust of the site with card details at 19% and a required account at 18%. Those shares are survey answers, not your data. The step funnel tells you which one applies to you. Step-by-step diagnosis is in how to reduce checkout abandonment and the wider picture in purchase path.
Impulse buying. The trace is a purchase in the first session, often of a promoted item, with a short time from first view to order. The rule: a high first-session conversion on cheap items is normal; the same pattern on a high-priced item usually means the visitor already knew the product, so look at the source.
Channel switching. A person looks on a phone and buys on a laptop. If your reports count devices instead of people, this looks like two visitors, one who never bought and one who bought without browsing. Tie sessions to a person after login so the journey stays in one piece.
A last point on price-triggered buying: orders that spike on sale days are real, but check what happens in the two weeks after. If orders fall below your normal level, part of the spike was pulled forward from later.
Recommendation and referral: when the visit starts with someone else
Some buying begins outside your site: a friend shares a link, a reviewer mentions you, a forum thread points to a product page, or an AI assistant names your shop in an answer. Google's research lists social proof and authority among the biases that sway purchase choices; in analytics those influences arrive as referrers.
Signals to check:
- Referrers and sources. New domains sending visitors, and the share of visits from AI assistants, show where recommendations come from.
- Landing page. Referred visitors tend to land on a specific product or article, not the home page. A cluster of direct visits to one deep page, with no campaign running, often means a link shared in a chat or an email.
- Behavior after landing. Compare conversion for referred and non-referred visitors in the same month. Do not assume referrals convert better; check.
Sample data: of 600 orders in a month, 90 came from visitors whose first source was a referral or AI assistant. That is 90 ÷ 600 = 15.0%. If those sources send 6% of visits, they convert at about 2.5 times the average visit. Change the numbers for your own site, and watch the sample size: 90 orders can move a few points in a week.
How to check that a behavior is real
A pattern on a chart is a lead. Four checks turn it into something you can act on.
- Remove non-human traffic first. Crawlers inflate visits, sessions and product views, and make shoppers look more indecisive than they are. Count people only.
- Use the same period and comparable traffic. A behavior seen during a sale week may not hold in a normal week.
- Check the group size. With under about 30 people or a handful of orders, a rate can move by 10 points on one customer.
- Look for a second signal. Comparison shopping should show up both as more sessions and as more product views per buyer. If only one moves, it may be a tracking change.
If a behavior passes these checks, give it a name, write down the number, and pick one change to try. Then measure the same number again after the change.
Common mistakes with consumer behavior data
- Treating a theory as a measurement. "Scarcity drives sales" is not in your data until you can name the event: for example, add-to-cart from products with "low stock" labels against products without.
- Averaging different behaviors together. The 22.0% repeat rate above hides 15.0% and 26.7%. Split before you average.
- Comparing devices instead of people. Cross-device journeys inflate abandonment on phones and flatter desktop conversion.
- Ignoring time. Behaviors drift by season, by campaign and by the first-order offer. Mark changes on the chart and compare equal periods.
- Reading survey shares as your shares. Baymard's percentages describe a US survey. Your funnel decides which row applies to you.
See these behaviors in TapCub
Take the comparison-shopping and repeat-purchase examples above and look at your own store.
- See how many sessions buyers use. In All-platform analytics › Behavior › Behavior analysis, build a funnel from product view to purchase, then open a visitor in Web analytics › Audience to see session history, frequent pages and multi-page journeys. Web analytics › Audience also shows new and returning visitors side by side, with sessions, bounce and conversions. New versus returning needs the default balanced privacy mode, because strict mode changes the salt every day and cannot link visits across days.
- Measure repeat purchase. Use retention with the purchase event as both the start and the return event, by week for up to 12 weeks. Purchases need to be on the order ledger first (track ecommerce purchases). Read the retention report guide for the exact options.
- Split by first-order behavior. Create segments such as "first order used a discount code" and "first order without a code" in All-platform analytics › Users › Segments & tags, then apply each one to the retention report. Segments contain identified people, not anonymous visitors, so call
tapcub.loginwhen users log in (identify users). - Tier customers by recency, frequency and spend. RFM segments in All-platform analytics › Users › Segments & tags and All-platform analytics › Business › Commerce & revenue show headcount and movement between groups (run RFM analysis).
- Find where recommendations come from. Web analytics › Sources has an AI sources tab for human visits that arrived from AI products, next to channels, referrers and UTM.
TapCub measures behavior; it does not run promotions, price tests or email campaigns. Use your store platform for those, then return to the same reports to see whether the behavior changed.
FAQ
What are some examples of consumer behavior?
Common examples are comparison shopping across several visits, impulse buying in the first session, abandoning a cart, buying when a discount code is available, ordering again weeks later, switching to another shop, browsing on one device and buying on another, and arriving through a friend's link or a review. Each leaves a visible trace in visits, events or orders.
What are the four types of consumer buying behavior?
Marketing textbooks often list complex buying, dissonance-reducing buying, habitual buying and variety-seeking buying. They describe how involved a shopper is and how different the brands look. In analytics they appear as long consideration with many visits, quick repeat orders, and switching between products. This article groups behaviors by the trace they leave rather than by textbook type.
How do you measure consumer behavior?
Pick one behavior, name the event or number where it would show, and compare groups over equal periods. For example, repeat rate within 12 weeks for customers who used a code on the first order against those who did not. Remove bot traffic, count people instead of orders or devices, and wait until the measurement window has closed.
Is consumer behavior the same as customer behavior?
Mostly. Consumer behavior covers anyone who may buy, including people who only browse. Customer behavior usually means people who already bought. For a site owner the practical difference is the data: consumer behavior starts with anonymous visits, while customer behavior needs a login or an order to tie actions to a person.
Which consumer behaviors matter most for an online store?
Start with the ones that lose or win money directly: step-level abandonment in checkout, repeat purchase, and the sources that bring buyers. The rest, such as comparison shopping and device switching, explain why those numbers move. Check the behaviors that your own funnel and orders can actually support with enough data.
Sources
- Google, Navigating purchase behavior and decision-making (the messy middle, exploration and evaluation, six biases). Checked 2026-11-18.
- Baymard Institute, Cart Abandonment Rate Statistics (reasons shoppers give for leaving a cart; 70.22% average). Checked 2026-11-18.
- Wikipedia, RFM (market research) (recency, frequency and monetary value). Checked 2026-11-18.
Was this article helpful?
We use your answers to fix and expand this page.
Couldn’t send. Please try again in a minute.
Thanks for the feedback. We’ll use it to improve this page.You’ve already sent feedback on this page. Thanks.

Product Analyst
Focuses on event analysis, conversion funnels, and retention, using clear metric definitions and structured analysis to explain product performance.