Try it on your own data
Every report in this article is in the free plan. One snippet for web and apps, up to 10 sites.
Start freeContent metrics are measurements of how content performs, and they fall into four purposes: reach, engagement, conversion and retention, each with its own numbers. A number that suits one purpose can be irrelevant to another. This guide shows how to choose one primary metric and one guardrail per piece, with a worked example where one post wins on reach and another on conversion.
What you will learn
- Choose metrics by purpose — reach, engagement, conversion, retention — not by what the tool displays first
- Name one primary metric and one guardrail for each piece before publishing; a blended score hides which job failed
- Credit assisted conversions: in the sample, blog posts were the first touch for 33.3% of signups but the last touch for only 6.7%
What are content metrics, and how are they different from KPIs?
Content metrics are measurements of how a piece of content performs: how many people it reached, how they behaved, whether they took a next step and whether they came back. A metric is any such number; a KPI is the one or two metrics you have agreed to manage against a goal. A site can track forty content metrics and have two KPIs.
The mistake most teams make is picking metrics by what the analytics tool displays first. Pick them by purpose instead. Content is published to do one of four jobs, and each job has its own numbers; a number that is good for one job can be irrelevant to another.
Which metrics belong to which purpose?
| Purpose | The question | Metrics to look at | Not enough on its own |
|---|---|---|---|
| Reach | Did the right people find it? | Search impressions and clicks, sessions, new users, referral sources | Page views alone |
| Engagement | Did they actually use it? | Engagement rate, engaged time, scroll depth, pages per session | Time on page |
| Conversion | Did they take a next step? | Conversions per session, assisted conversions, revenue per session | Last-click count |
| Retention | Do they come back? | Returning-visitor share, repeat visits in 30 days, subscribers still active | Subscriber total |
For longer metric lists, see content performance metrics; for how the analytics around content fits together, content marketing analytics. This guide's contribution is the rule that comes next.
| Purpose | The question | Metrics to look at |
|---|---|---|
| Reach | Did the right people find it? | Search clicks, sessions, new users |
| Engagement | Did they actually use it? | Engagement rate, scroll depth |
| Conversion | Did they take a next step? | Conversions per session, assisted conversions |
| Retention | Do they come back? | Returning-visitor share |
For each piece, pick one primary metric and one guardrail from its purpose.
How do you choose one primary metric per piece of content?
Write the content's purpose in one sentence before publishing, then name one primary metric and one guardrail:
- Primary metric: the number that says whether the purpose was met. A top-of-funnel guide's purpose is reach, so its primary is search clicks or new users.
- Guardrail: a number that must not collapse while you chase the primary. For a reach piece, an engagement rate that stays above your normal level.
- Decision rule: what you will do if the primary is low (rewrite, promote, merge, retire).
If a piece has two purposes, it probably should be two pieces. A page that tries to rank for a broad query and also sell a product usually does neither well, and its numbers cannot tell you which job failed.
Worked example: two posts, four purposes, no obvious winner
Sample data for one month, two blog posts:
| Metric | Post A (broad guide) | Post B (comparison page) |
|---|---|---|
| Sessions (reach) | 12,000 | 3,000 |
| Engaged sessions | 6,600 | 1,950 |
| Engagement rate | 55.0% | 65.0% |
| Newsletter signups (conversion) | 96 | 90 |
| Signups per session | 0.80% | 3.00% |
| Returning visitors (retention) | 1,440 of 9,600 users = 15.0% | 560 of 2,400 users = 23.3% |
Calculations: engagement rate = 6,600 ÷ 12,000 = 55.0% and 1,950 ÷ 3,000 = 65.0%. Signups per session = 96 ÷ 12,000 = 0.80% and 90 ÷ 3,000 = 3.00%. Returning share = 1,440 ÷ 9,600 = 15.0% and 560 ÷ 2,400 = 23.3%.
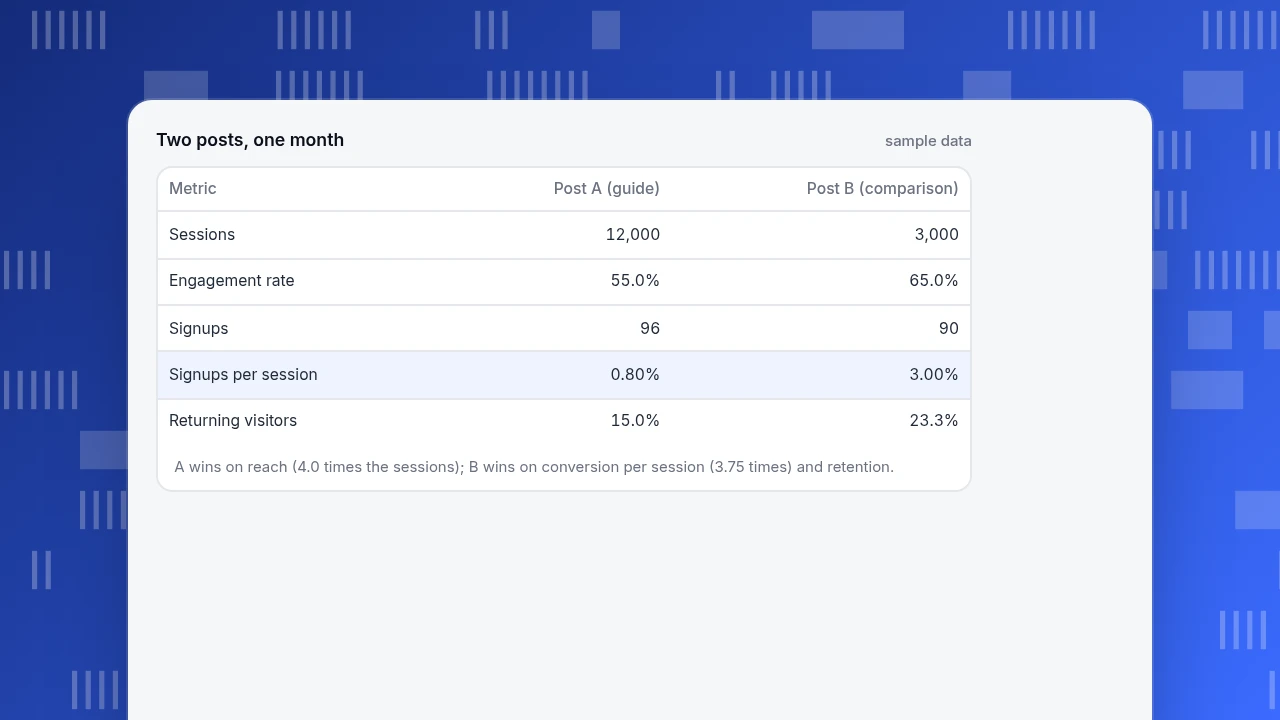
Post A reached four times as many sessions (12,000 ÷ 3,000 = 4.0). Post B converted 3.75 times as well per session (3.00% ÷ 0.80%) and brought back more readers. In absolute signups they are almost equal, 96 versus 90. "Which is better?" has no answer without a purpose: if A was written to be found, it is doing its job and needs a better handoff to a signup; if B was written to convert, it is near its ceiling for traffic and needs more reach. The right action differs for each: improve the call-to-action on A, earn more search traffic for B. Ranking them on one blended score would hide this.
Two posts, one month
sample data| Metric | Post A (guide) | Post B (comparison) |
|---|---|---|
| Sessions | 12,000 | 3,000 |
| Engagement rate | 55.0% | 65.0% |
| Signups | 96 | 90 |
| Signups per session | 0.80% | 3.00% |
| Returning visitors | 15.0% | 23.3% |
A wins on reach (4.0 times the sessions); B wins on conversion per session (3.75 times) and retention.
What do engagement metrics tell you, and what do they not?
Engagement rate is the share of sessions that were engaged. Google Analytics defines an engaged session as one that lasts longer than 10 seconds, records a key conversion event or includes at least two page or screen views, and bounce rate as the share of sessions that were not engaged. Two consequences:
- Engagement is a low bar. A 12-second visit counts as engaged. It tells you people did not leave at once, not that they read.
- Time is not reading. Jakob Nielsen's analysis of browsing data found an average page of 593 words, and that visitors read at most about 28% of the words and more realistically about 20%. At 250 words per minute, a full read of 593 words takes about 2.4 minutes (593 ÷ 250 = 2.37); a 40-second visit cannot have covered it. Treat time and scroll depth as signals about attention, and look at what happened next (a click, a signup) to judge value.
Compare engagement within the same type of page. A short answer page with a 70% engagement rate and a long guide at 50% may both be healthy.
How do you credit content for conversions it helped but did not close?
Content often influences a conversion without being the last page before it. If you count only last-touch conversions, early-stage content looks weaker than it is. Sample data: 120 signups in a month; the visitor's first content page was a blog post for 40 of them (33.3%), and the blog post was the last page before signing up for only 8 (6.7%). A last-click view would conclude blog content produced under 7% of signups; a first-touch view says a third of signups started with it.
Neither view is "right"; each answers a different question. Use first-touch to judge discovery content, last-touch to judge decision content, and a multi-touch model (linear or position-based) when you want to see every page that took part. Attribution models are covered at attribution.
Which content metrics are vanity metrics?
Apply one test: if this number went up or down by 20%, what would I do differently? If the answer is nothing, it is a vanity metric for you, whatever its popularity.
- Page views alone usually fail the test; they rise with one viral share and tell you nothing about the next step.
- Social likes can be useful for a social purpose but do not predict conversion.
- Subscriber total fails; active subscribers or replies pass.
- Average time on page fails when it is the only number; paired with scroll depth and a next action, it passes.
The same metric can pass in one team and fail in another; the test is about decisions, not about the metric.
How often should you review content metrics, and what should you compare?
Review monthly for movement and quarterly for decisions, always comparing equal windows (28 days against the previous 28 days, or the same month last year for seasonal content). A page whose primary metric falls steadily over three comparable periods is a candidate for a refresh; see content decay for how to tell decay from seasonality and what to do about it.
Annotate publishing dates, updates and campaigns on your charts, or you will not remember what moved a line.
Which mistakes make content metrics misleading?
- One blended score for all purposes. The worked example shows why.
- Comparing a guide with a landing page. Different jobs, different normal ranges.
- Treating time on page as reading time. See the 593-word calculation.
- Counting bots as readers. Automated visits inflate sessions and pull rates down.
- Judging only by last-touch. It undervalues discovery content.
- Changing the definition mid-quarter. The trend moves with no change in behaviour.
- Tracking everything. Forty metrics and no decision rule is a report, not a measurement plan.
How to measure content with TapCub
Take Post A and Post B from the example.
- Reach. Web analytics › Pages lists pages with visitors and views; Web analytics › Sources shows channel, source and UTM. If you connect Google Search Console or Bing Webmaster, Monitoring › Search performance shows clicks, impressions, click-through rate and average position by page and query, normally one to three days late.
- Engagement. Bounce rate and average duration are built-in measures (you can also alert on them in All-platform analytics › Operations › Monitors); TapCub does not report Google's engaged-session rate, so keep one definition and compare within it. If autocapture is on (Pro plan or higher), All-platform analytics › Behavior › Heatmaps has a Scroll reach tab, where each row is the share of visits that reached that depth.
- Conversion. Set a goal under Web analytics › Goals for the signup (a thank-you page or an event) and read its conversion rate by entry page and source; the rate divides by unique visitors in the range.
- Attribution. In All-platform analytics › Behavior › Behavior analysis, choose first, last, linear, position and time-decay models side by side and set the touchpoint to landing page, so you can see first-touch and last-touch credit for each post in one view.
- Compare windows and annotate. Use the date comparison and add a date annotation for each update under Configuration › Annotations. Bots are counted separately from people, so crawlers do not inflate sessions.
TapCub does not collect social likes, email open rates or CMS metrics such as words published; bring those from the tools that own them.
FAQ
What are content metrics?
Measurements of how content performs: reach, engagement, conversion and retention. A metric is any such number; a KPI is the one or two you manage against a goal. Choose them by the purpose of each piece of content, not by what a tool displays first.
What are the most important content metrics?
It depends on the purpose. For a piece meant to be found, search clicks and new users; to engage, engagement rate and scroll depth; to convert, conversions per session; to retain, the returning-visitor share. In the sample, one post led on reach and the other on conversion.
How do you measure content performance?
Name one primary metric and one guardrail for each piece before publishing, compare equal time windows and check results by source. Then credit conversions with more than one attribution model, because last-touch undervalues discovery content.
What is a good engagement rate for content?
There is no universal figure; it depends on page type. In Google Analytics an engaged session lasts over 10 seconds, has a key event or has two or more views, so the bar is low. Compare against your own pages of the same type over time.
Which content metrics are vanity metrics?
Any that would not change your decision if they moved 20%. Page views alone, social likes and subscriber totals often fail that test; active subscribers, conversions per session and returning-visitor share usually pass.
See also: What Are UGC Videos? Types and How to Measure Them.
Sources
- Google. Engagement rate and bounce rate — an engaged session lasts longer than 10 seconds, has a key conversion event or has at least two page or screen views; bounce rate is the share of sessions that were not engaged. Read 2026-11-19.
- Nielsen, J. How Little Do Users Read?. Nielsen Norman Group — users read at most 28% and more realistically about 20% of the words on an average 593-word page. Read 2026-11-19.
Was this article helpful?
We use your answers to fix and expand this page.
Couldn’t send. Please try again in a minute.
Thanks for the feedback. We’ll use it to improve this page.You’ve already sent feedback on this page. Thanks.

Customer Experience Consultant
Writes about live chat, visitor conversations, and self-service, sharing practical ways to make customer communication clearer and more effective.