Try it on your own data
Every report in this article is in the free plan. One snippet for web and apps, up to 10 sites.
Start freeContent planning is deciding what to publish, for whom, by when and how you will know it worked. Start from topic clusters built on real reader questions, fit the top ones to your capacity with a buffer and schedule reviews at 30, 60 and 90 days. Below: topic sources, cluster scoring, a capacity example, calendar columns and review rules.
What you will learn
- Plan from reader questions and clusters, not brainstormed ideas; if the only reason is a keyword, skip it
- Capacity is the constraint: 288 hours with a 20% buffer fits 14 new articles and 9 updates, not 12 updates
- Put 30, 60 and 90-day reviews in the calendar with a rule for each result
What is content planning, and what does it produce?
Content planning is deciding what you will publish, for whom, by when and how you will know it worked. The output is not a document of ideas. It is a list in which every item has a reader question, an owner, a date and a measure.
It sits between strategy and production, and mixing them is why plans stall:
| Level | Question it answers | Typical output |
|---|---|---|
| Strategy | Who are we writing for and why? | Audience, goals, topics we will own |
| Plan | What will we publish this quarter? | A ranked list of topics, with owners and capacity |
| Calendar | What goes out on which date? | Dated items, drafts, reviews |
| Review | Did it work, and what changes? | A decision per piece: keep, update, merge, stop |
The thesis of this guide: plan from topic clusters and real reader questions, then fit them to your capacity and a review rhythm. Brainstormed ideas are cheap; capacity is the constraint, so the useful part of a plan is the arithmetic that says what you can actually finish. Measuring results is covered in content marketing analytics, the review of what already exists in content audit and grouping queries in keyword grouping. This guide connects them into one planning cycle.
| Level | The question | Output |
|---|---|---|
| Strategy | Who are we writing for and why? | Audience, goals, topics to own |
| Plan | What do we publish this quarter? | Ranked topics, owners, capacity |
| Calendar | What goes out on which date? | Dated items and reviews |
| Review | Did it work? | Keep, update, merge or stop |
Mixing strategy with production is why plans stall.
Where do good topics come from?
Start from what readers already ask, not from what you would like to say. Five sources are available to nearly every team:
| Source | What it gives you | Where to look |
|---|---|---|
| Search queries | Words people used and the pages that showed | Search console: queries with impressions but few clicks |
| Support conversations | Questions customers could not answer from your site | Chat transcripts, tickets, offline messages |
| Sales calls | Objections and comparisons | Call notes, deal losses |
| On-site search | What visitors looked for and did not find | Site search terms |
| Existing pages | Pages that rank but do not satisfy | Pages with impressions and weak engagement |
Google's guidance on helpful content is a useful test for each idea. Its "Why" question asks why the content is being created in the first place and says the answer should be to help people who visit directly, not mainly to attract search visits. If the honest answer to an idea is "to rank for a keyword", it is not ready for the plan.
How do you turn questions into clusters?
Collect questions, group the ones that one answer would settle, and treat each group as a cluster: one anchor page plus supporting pages that answer the narrower questions and link to it. The mechanics of grouping queries are in keyword grouping.
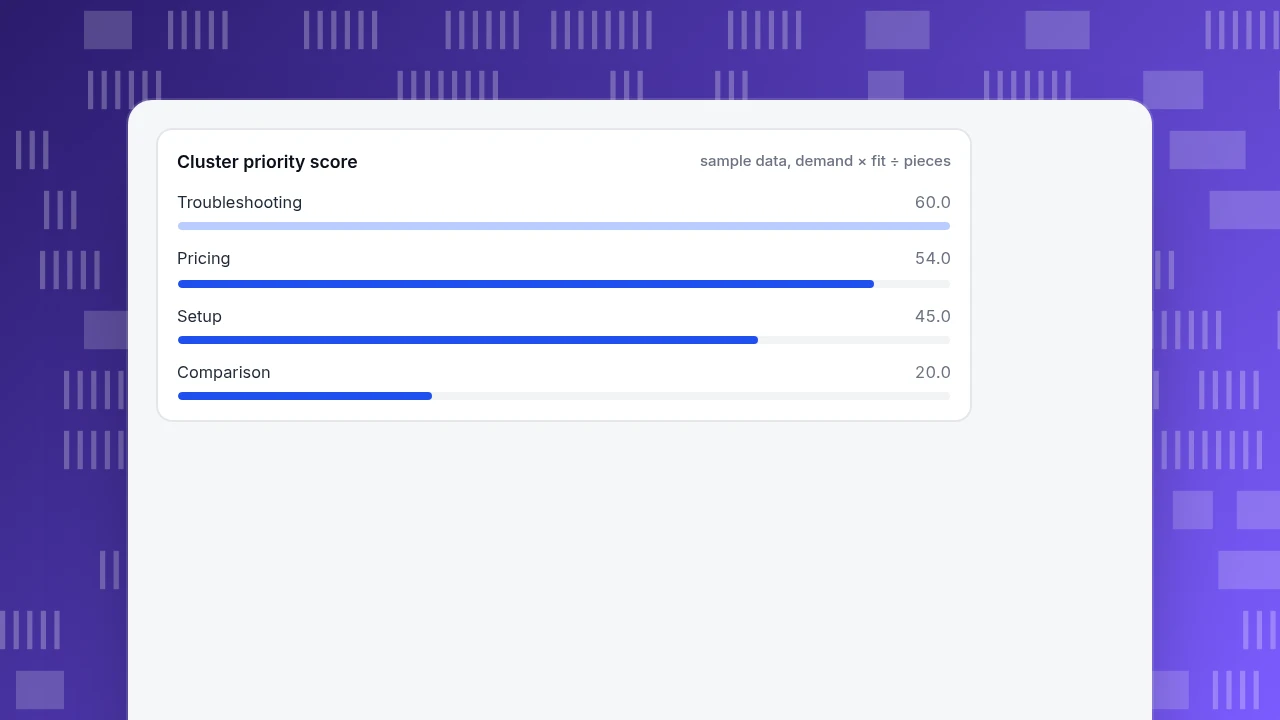
Then rank clusters. A simple score is reader demand × business fit ÷ pieces needed, where demand is questions a month (chat plus search), fit is 1 to 3 for how close the topic is to what you sell, and pieces is the number of articles the cluster needs.
Sample data: 24 questions fall into four clusters.
| Cluster | Questions | Demand a month | Fit (1–3) | Pieces needed | Score |
|---|---|---|---|---|---|
| Troubleshooting | 5 | 150 | 2 | 5 | 150 × 2 ÷ 5 = 60.0 |
| Pricing | 5 | 90 | 3 | 5 | 90 × 3 ÷ 5 = 54.0 |
| Setup | 8 | 120 | 3 | 8 | 120 × 3 ÷ 8 = 45.0 |
| Comparison | 6 | 60 | 2 | 6 | 60 × 2 ÷ 6 = 20.0 |
The order is troubleshooting, pricing, setup and comparison. Troubleshooting wins even though its fit is lower, because many people ask and it needs few pieces. The score is a tool for the conversation, not a verdict: a cluster with a lower score may still be first if a launch depends on it. The demand figures are sample data.
Cluster priority score
sample data, demand × fit ÷ piecesHow much can you actually publish?
Capacity, not ideas, limits the plan. Work out the hours and subtract a buffer.
Sample data: one writer with 24 content hours a week, over a 12-week quarter.
| Item | Calculation | Hours |
|---|---|---|
| Total capacity | 24 × 12 | 288 |
| Buffer for slips, 20% | 288 × 0.20 | 57.6 |
| Hours you can commit | 288 − 57.6 | 230.4 |
| New article (10 h writing + 2 h review) | 14 × 12 | 168 |
| Update of an existing article (4 h + 2 h review) | 9 × 6 | 54 |
| Planned total | 168 + 54 | 222 |
222 hours fits inside 230.4, so the plan is 14 new articles and 9 updates, 23 pieces in the quarter, with 8.4 hours spare. A first draft of this plan would have said 14 new and 12 updates (168 + 72 = 240 hours), which does not fit: 240 is more than 230.4. Cutting three updates is the cheap fix, and doing it before the quarter starts is the point. Replace the hours per piece with what your own team actually takes.
What goes in the calendar?
One row per piece. The columns that earn their place:
| Column | Why |
|---|---|
| Topic and cluster | Keeps the plan tied to the cluster order above |
| Reader question | The article answers this; if you cannot write it, the topic is not ready |
| Format and length | Guide, comparison, glossary entry, update |
| Owner and reviewer | One named person each |
| Draft, review and publish dates | Dated, not "Q2" |
| Link targets | Which existing and planned pages it links to and from |
| Success measure | The single number you will check |
Publish clusters together, not one article a week from different clusters. An anchor page and two supporting pages inside four weeks means the internal links exist when each goes live. Leave one slot a month for an update, so that already-published pieces do not decay unseen. When a launch or event fixes a date, put it in first and plan around it, so that supporting pieces are ready before the moment arrives rather than after it.
Should a slot go to a new piece or an update?
Both cost hours, and the sample plan priced them differently: 12 hours for a new article, 6 for an update. Use a rule rather than taste:
| Situation | Choose | Why |
|---|---|---|
| The cluster has no page for this question | New piece | Nothing to update |
| A page already gets impressions but sits below the top results | Update | The page has shown it can be found; the answer needs work |
| Two pages answer one query | Merge, then update the survivor | Overlap splits the signal |
| The page is accurate and performing | Leave it | A slot spent here earns nothing |
In the capacity example, nine updates at 6 hours cost 54 hours, the price of 4.5 new articles. If those nine pages already have impressions, they are the cheaper route to clicks; if they do not, the hours are better spent on new pieces.
How do you review what you published?
Put the checks in the calendar at the start. At 30, 60 and 90 days after publication look at the page's impressions, clicks and goal completions, and apply a rule:
| What you see | Likely cause | Action |
|---|---|---|
| Impressions rising, clicks low | Title or description does not match the query | Rewrite title and description |
| Average position 8–15 | Close to page one; answer is thin | Update with the missing section |
| No impressions at 90 days | Not indexed, or no demand | Check indexing; merge or retire |
| Clicks but no goal completions | Wrong audience or no next step | Add a clear next step or change the topic |
| Two pages for one query | Overlap | Merge and redirect |
The Performance report in search console shows clicks, impressions, click-through rate and average position by query, page, country and device (Search Console help); that is the data for the first four rows.
What goes wrong in content planning?
- Planning from ideas instead of questions. Brainstorms produce topics nobody searches for.
- Ignoring capacity. The plan above would have overrun by 9.6 hours before it started.
- Spreading across clusters. One page from each of ten clusters builds nothing.
- A calendar without a measure. You cannot tell what to repeat.
- Never updating. A plan that only counts new pieces lets old ones decay.
- Keywords as the reason. If the only answer to "why" is a keyword, skip it.
How do you feed and review a content plan with TapCub?
Take the troubleshooting cluster. TapCub does not manage editorial calendars or do keyword research. It supplies two things the plan needs: the reader questions and the review data.
- For questions, open Live chat › Inbox and the offline messages, and in Live chat › Reports read the knowledge base hit rate. Questions that fell through to a person with no knowledge match are articles you have not written yet.
- Connect Google Search Console or Bing Webmaster and open Monitoring › Search performance. It shows clicks, impressions, click-through rate and average position by page, query and country; pages ranking in the top 10 with a click-through rate below the median are flagged, and changing the title and description there is the cheapest fix. Data arrives one to three days late.
- In Configuration › Annotations, mark each publish and update date so the traffic chart explains itself.
- In Web analytics › Pages and Web analytics › Sources, check visitors and channels for each piece, and in Web analytics › Goals whether readers converted.
- In Web analytics › Bots, the AI & agents tab shows how often AI crawlers read your pages and how many human visitors they brought back.
FAQ
What is content planning?
Content planning is deciding what to publish, for whom, by when and how to measure it. The output is a ranked list of topics with a reader question, an owner, a date and a success measure for each, sized to the capacity of the team.
How do you create a content plan?
Collect reader questions from search, support, sales and site search; group them into clusters; rank clusters by demand, fit and effort; fit the top ones to your hours with a buffer; put dated items in a calendar; and schedule 30, 60 and 90-day reviews.
How far ahead should you plan content?
A quarter is a practical horizon for most teams: long enough to publish a whole cluster, short enough to change course. Plan the first month in detail and the rest in outline, and revisit the plan after the first reviews.
What is the difference between content strategy and content planning?
Strategy defines the audience, goals and topics you will own. Planning decides which pieces you will publish this quarter, with owners, dates and capacity. A strategy without a plan stays an intention; a plan without a strategy publishes disconnected pieces.
How many articles can one writer publish a quarter?
It depends on hours per piece. With 24 content hours a week, a 12-week quarter, a 20% buffer, 12 hours per new article and 6 per update, the sample plan fitted 14 new articles and 9 updates. Use your own hours per piece to size yours.
Sources
- Google Search Central. Creating helpful, reliable, people-first content: the Who, How and Why questions. Verified 2026-11-19.
- Google Search Console Help. Performance report (Search results): clicks, impressions, CTR, average position by query, page, country and device. Verified 2026-11-19.
Was this article helpful?
We use your answers to fix and expand this page.
Couldn’t send. Please try again in a minute.
Thanks for the feedback. We’ll use it to improve this page.You’ve already sent feedback on this page. Thanks.

Product Experience Specialist
Explores usability, user journeys, and feature adoption through practical examples of onboarding and everyday product use.