Try it on your own data
Every report in this article is in the free plan. One snippet for web and apps, up to 10 sites.
Start freeClient retention is the share of clients still with you at the end of a period: (clients at end − new clients) ÷ clients at start. Three habits drive it: get each client to an early result, show value on a schedule and watch for warning signs before they leave. In the sample below, halving churn from 20% to 10% doubled lifetime margin per client from $36,000 to $72,000.
What you will learn
- Measure three ways: client retention, gross revenue retention and net revenue retention
- Retention is won early and in between, not at renewal: early success, ongoing value, timely warning
- Back-test your warning signals on clients who left before you trust them
What is client retention, and how do you measure it?
Client retention is the share of your clients who are still clients at the end of a period. It is the mirror image of churn: a client you kept is a client you did not lose. Three numbers cover it, and each answers a different question.
| Measure | Question | Formula | Sample result |
|---|---|---|---|
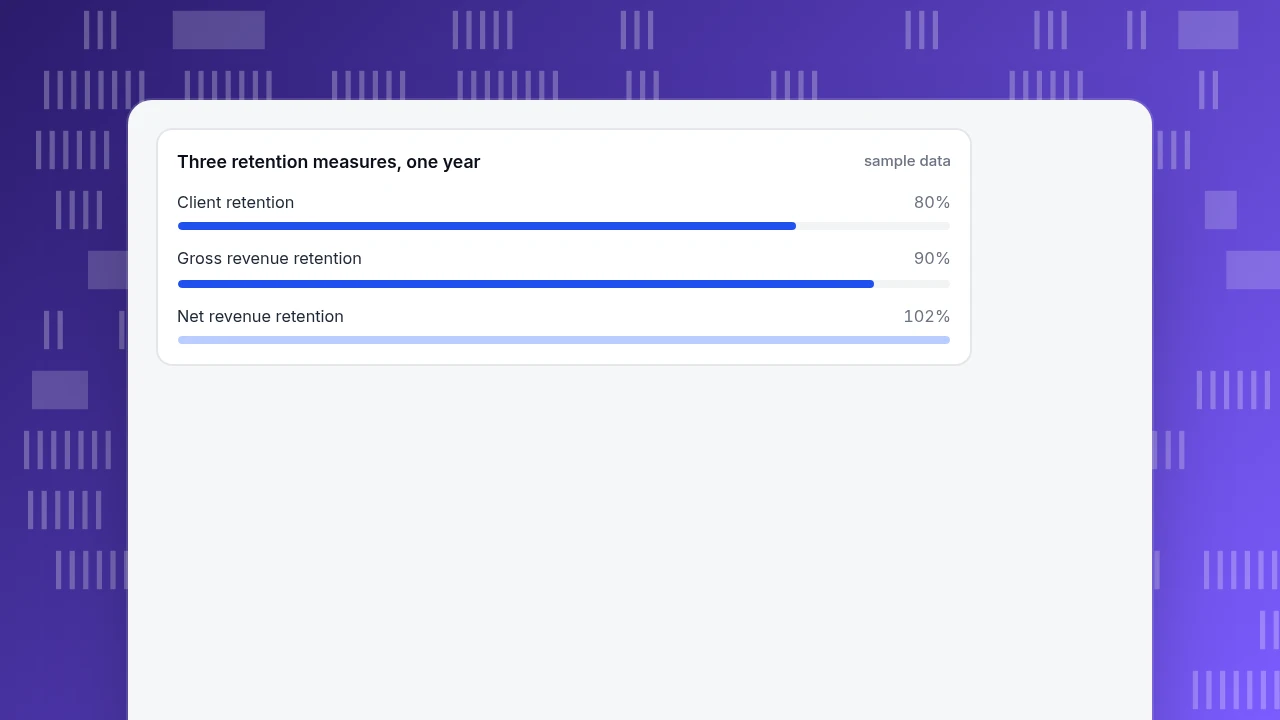
| Client (logo) retention | How many clients did we keep? | (clients at end − new clients) ÷ clients at start | (190 − 30) ÷ 200 = 80% |
| Gross revenue retention | How much recurring revenue did we keep, ignoring growth? | (start revenue − churned − contraction) ÷ start revenue | (100,000 − 6,000 − 4,000) ÷ 100,000 = 90% |
| Net revenue retention | Did the clients we kept grow or shrink overall? | (start revenue − churned − contraction + expansion) ÷ start revenue | (100,000 − 6,000 − 4,000 + 12,000) ÷ 100,000 = 102% |
Sample data: 200 clients at the start of the year, 30 signed during the year and 190 at the end; a $100,000 monthly revenue base that lost $6,000 to clients leaving, $4,000 to clients paying less and gained $12,000 from clients paying more.
Read them together. Logo retention of 80% with net revenue retention of 102% means you lose small clients and grow large ones. That calls for a different plan than the reverse. Definitions of the revenue versions are in gross revenue retention and net revenue retention; how retention differs from churn is in churn rate vs retention rate.
Three retention measures, one year
sample dataWhy is client retention worth the effort?
Because a client who stays keeps paying, and the longer they stay the more each one is worth. Reichheld and Sasser's 1990 Harvard Business Review study of service businesses found that cutting defections by 5 percentage points raised profits by between 25% and 95%, depending on the industry. The mechanism is simple: you already paid to acquire a retained client, so each extra year is mostly margin.
You can put your own numbers on this with a rough lifetime estimate. If churn stays roughly constant, expected lifetime in years ≈ 1 ÷ annual churn rate.
Sample data: a client pays $12,000 a year at a 60% margin, so each year contributes $7,200.
- Annual churn 20%: lifetime ≈ 1 ÷ 0.20 = 5 years, lifetime margin ≈ 5 × $7,200 = $36,000.
- Annual churn 10%: lifetime ≈ 1 ÷ 0.10 = 10 years, lifetime margin ≈ 10 × $7,200 = $72,000.
Halving churn doubled the value of every client you sign. The approximation breaks down if churn is not stable, which it rarely is in the first year, so treat it as a way to compare options, not a forecast. The full calculation is in customer lifetime value.
What are the three things that keep clients?
Retention comes from three things, in this order of time: early success, ongoing value and timely warning. Each needs a definition you can check.
| Lever | What to define | What to measure | Sample rule |
|---|---|---|---|
| Early success | The first result the client bought you for | Days from signing to that result | "A new client reaches the first result within 30 days" |
| Ongoing value | How the client sees the value repeatedly | Active use and results reviewed on a schedule | "Every client gets a results review each quarter" |
| Timely warning | Signals that appear before a client leaves | The signals in the next section, checked weekly | "Any client that trips two signals gets a call this week" |
Early success. Most departures are decided early, when a client has paid but not yet seen a result. Name the single result they signed up for, set a deadline and treat a miss as an emergency. A client who is still waiting on week six is leaving even if they have not said so.
Ongoing value. A client does not remember value, they notice its absence. Schedule a review that shows what changed since last time, in the client's terms rather than yours.
Timely warning. Clients seldom announce they are leaving. They go quiet, use less and skip meetings. The next two sections turn that into a routine.
Which warning signs show up before a client leaves?
Start with this list and then test it against your own history.
| Signal | Example threshold (sample) | Why it matters |
|---|---|---|
| Activity drops | Usage down 50% or more against the client's own previous 30 days | Less use usually means less value |
| Fewer people involved | Active users from the client fell by half | Fewer champions means fewer defenders at renewal |
| Key contact leaves | The person who signed or ran the account is gone | The relationship has to be rebuilt |
| Support turns negative | Two unresolved complaints in 30 days, or a poor satisfaction score | Unresolved friction is the usual reason given later |
| Review meetings skipped | Two meetings in a row declined or cancelled | A client who stops looking at results has stopped caring about them |
| Payment friction | Invoice more than 14 days late | A sign of low priority |
Test the list on your own past clients before trusting it. Take the clients who left in the last 12 months and ask which signals appeared in the 60 days before they left. Then check how often the same signal appears among clients who stayed.
Sample data: 20 clients churned and 80 stayed. "Activity down 50%" appeared before 14 of the 20 who left (70%) and for 16 of the 80 who stayed (20%). Flagging everyone who trips it gives 14 + 16 = 30 flags. Of those, 14 are real losses: 14 ÷ 30 = 46.7%. You catch 70% of departures, and about half of your calls go to clients who would have stayed anyway.
That is a useful warning, not a prophecy. A call that costs 15 minutes and goes to a client who was fine is cheap; a missed departure is not. Adjust the threshold so the number of flags is a number your team can actually follow up on.
| Signal | Example threshold (sample) | Why it matters |
|---|---|---|
| Activity drops | Usage down 50% or more vs the client's own previous 30 days | Less use usually means less value |
| Fewer people involved | Active users from the client fell by half | Fewer champions at renewal |
| Key contact leaves | The person who signed or ran the account is gone | The relationship must be rebuilt |
| Review meetings skipped | Two in a row declined or cancelled | The client has stopped looking at results |
Back-test the list on clients who left in the last 12 months and adjust thresholds every quarter.
What should happen when a client gets flagged?
A flag with no owner is just a number. Decide the routine before the first flag arrives:
- One owner per client. The flag goes to a named person, not a shared inbox.
- Contact within two working days, by a person, not an automated message. Ask a question that can be answered in a sentence: "What would make this more useful to you this quarter?"
- Listen for the cause, not the symptom. "We are busy" is often "we are not sure it is working".
- Agree one next step with a date, such as a results review or a training session, and put it in the account record.
- Log the outcome (stayed, left, unclear) so that you can retune the thresholds in the next quarterly review.
What do teams get wrong about client retention?
- Starting retention at renewal. By the renewal conversation the decision is mostly made. The work is in the first 30 days and the months in between.
- Watching logo retention only. A flat 80% can hide the loss of your largest clients. Track revenue retention beside it.
- Treating all clients alike. Warning signals for a client with 50 users differ from those for a client with 2. Compare each client with its own previous 30 days.
- Relying on a satisfaction score alone. Quiet clients do not answer surveys. Use behaviour as well.
- Setting thresholds once. Back-test them against who left, and adjust them every quarter.
- Giving discounts as the first response. A discount fixes price; most departures are about value.
- Ignoring who the client's champion is. If only one person uses the product, you have a single point of failure.
How do you do this in TapCub?
Here is how a software team with business customers would run the warning routine in TapCub. TapCub measures activity and flags change; it is not a CRM, does not predict churn with a score and does not contact anyone for you.
- Group people into client accounts. After login, the product calls
tapcub.group('company', 'acme', {...}). In All-platform analytics › Users › Accounts you then see each account's members, its activity in the last 30 days and a Health score from 0 to 100: members active in 30 days (up to 40 points), share of active days (up to 30) and recency (30 points if seen within 7 days, 15 within 30 days). - Check early success. In All-platform analytics › Behavior › Behavior analysis, run a funnel from the first event (for example "invited a teammate") to the result event, then Retention to see whether a cohort of new people comes back by day, week or month. Retention can also be run with account identity.
- Read the lifecycle. The same page shows new, returning, resurrecting and dormant counts per week or month, so you can see whether more people are going quiet than coming back.
- Flag the quiet. Create a rule segment in All-platform analytics › Users › Segments & tags from "did" and "did not do" conditions (a key event done before, not done recently), refreshed daily. In All-platform analytics › Operations › Monitors, set a monitor on a metric such as sessions and use the trial run to see how often it would have fired in the past 30 days. Monitors only notify; they do not act.
- Act outside TapCub. The call, the review meeting and the renewal record live in your CRM or helpdesk. TapCub's role is to tell you who changed, when.
Account views are organisation-level: they cannot open a person's detail, and segments cannot be added to account analyses.
FAQ
What is client retention?
It is the share of clients who are still clients at the end of a period: (clients at end − new clients) ÷ clients at start. In the sample, 190 at the end, 30 new and 200 at the start gives 80%. Pair it with revenue retention to see whether the clients you kept grew or shrank.
How do you calculate client retention rate?
Subtract the clients you gained in the period from your end count, then divide by your start count. (190 − 30) ÷ 200 = 80%. Subtract new clients, or you will count growth as retention. For revenue, use gross retention (no growth) and net retention (with expansion).
What are the best client retention strategies?
Make three things routine: get each new client to a first result quickly, show ongoing value on a schedule, and watch for warning signals such as falling activity or a departing champion. The work is mostly before renewal, not at it.
How do you know when a client is about to leave?
Look for falling usage against their own history, fewer people involved, a key contact leaving, unresolved complaints, skipped reviews and late payments. Back-test the list on clients who left: in the sample, a 50% activity drop preceded 14 of 20 departures, at the cost of 16 false alarms among 80 who stayed.
What is a good client retention rate?
It depends on your type of business and contract, so benchmarks from other companies mislead. Compare yourself with your own past periods, and check whether your revenue retention is above or below 100%. Reichheld and Sasser's research suggests a few points of retention can change profit substantially.
Sources
- Frederick F. Reichheld & W. Earl Sasser Jr. Zero Defections: Quality Comes to Services. Harvard Business Review, September–October 1990: retention and profit across service industries. Verified 2026-11-19.
- Frederick F. Reichheld. Loyalty-Based Management. Harvard Business Review, March–April 1993: why retaining the right customers drives growth. Verified 2026-11-19.
Was this article helpful?
We use your answers to fix and expand this page.
Couldn’t send. Please try again in a minute.
Thanks for the feedback. We’ll use it to improve this page.You’ve already sent feedback on this page. Thanks.

Product Analyst
Focuses on event analysis, conversion funnels, and retention, using clear metric definitions and structured analysis to explain product performance.