Try it on your own data
Every report in this article is in the free plan. One snippet for web and apps, up to 10 sites.
Start freeMobile content marketing is best judged in three layers: load (did the page appear fast enough to read), read (did people get through it) and return (did they come back). Check them in that order on mobile data only, because a slow page makes good writing look boring. Below: thresholds, worked examples for each layer and a mobile versus desktop comparison.
What you will learn
- Measure in order: load, then read, then return, and keep mobile separate from desktop
- Judge speed at the 75th percentile: in the sample the median passed (2.3 s) while the page failed (2.9 s)
- Fix the earliest failing layer first; a slow page makes the reading numbers meaningless
What should you measure in mobile content marketing?
Mobile content marketing is publishing articles, videos, pages and messages meant to be read on a phone. Measure it in three layers, in this order: load (did the page appear fast enough to be read), read (did people get through it) and return (did they come back). A failure in an earlier layer hides the later ones: a slow page makes a good article look boring.
| Layer | Question | Metric | How to read it |
|---|---|---|---|
| Load | Did the page show up fast and stay stable? | Largest contentful paint (LCP), interaction to next paint (INP), layout shift (CLS) at the 75th percentile, mobile only | LCP 2.5 s or less, INP 200 ms or less, CLS 0.1 or less count as good |
| Read | Did they get through it? | Scroll reach at 25 / 50 / 75 / 100%, time on page, bounce | Where the drop is steepest tells you which section loses them |
| Return | Did they come back? | Share of new mobile readers who return within 7 days, newsletter sign-ups per session | Compare with desktop readers of the same article |
Metrics for the whole content program, such as organic traffic and assisted conversions, are in content marketing analytics. How mobile content fits a wider plan is in mobile marketing strategy. This guide is the measurement layer that sits under both.
| Layer | Fails if | First fix |
|---|---|---|
| Load | 75th-percentile LCP above 2.5 s, INP above 200 ms or CLS above 0.1 | Compress images, defer scripts, reserve space for embeds |
| Read | Reach drops steeply between two scroll steps | Rewrite the section where the drop sits for a phone screen |
| Return | 7-day return well below desktop | Add a related-article link or sign-up prompt after 50% scroll |
Sample thresholds from Core Web Vitals; fix in layer order.
How do you measure load on mobile, and what counts as fast enough?
Google's Core Web Vitals give three thresholds, assessed at the 75th percentile of page loads and reported separately for mobile and desktop: LCP of 2.5 seconds or less, INP of 200 milliseconds or less and CLS of 0.1 or less. A page passes only if all three are met at that percentile.
The 75th percentile matters because averages and medians hide the slow quarter of visits, and on phones that quarter is large. Sample data: 12 mobile page loads of one article, with LCP in seconds:
1.4, 1.6, 1.8, 1.9, 2.1, 2.2, 2.4, 2.6, 2.9, 3.3, 3.8, 4.6
| Statistic | How computed | Value |
|---|---|---|
| Median | Average of the 6th and 7th values: (2.2 + 2.4) ÷ 2 | 2.3 s |
| Mean | Sum 30.6 ÷ 12 | 2.55 s |
| 75th percentile | 9th value of 12 (ceil(0.75 × 12) = 9) | 2.9 s |
| Share at or under 2.5 s | 7 of 12 loads | 58.3% |
The median (2.3 s) looks good, but at the 75th percentile (2.9 s) the page fails the 2.5 s bar, and 5 of the 12 loads (41.7%) miss the bar. The desktop version of the same page in this sample had a 75th percentile of 1.8 s. If you only checked desktop, or only the median, you would call the page fast.
Rule: fix a page's mobile load before you rewrite its content. A page whose 75th-percentile LCP is above 2.5 s is losing readers that no headline will bring back.
How do you measure whether people actually read mobile content?
"Bounce rate" says someone left after one page; it does not say whether they read. Use scroll depth, with the page length in mind. A long article on a phone is many screens: a reader who reaches 50% has scrolled through a lot more content than the same percentage on desktop.
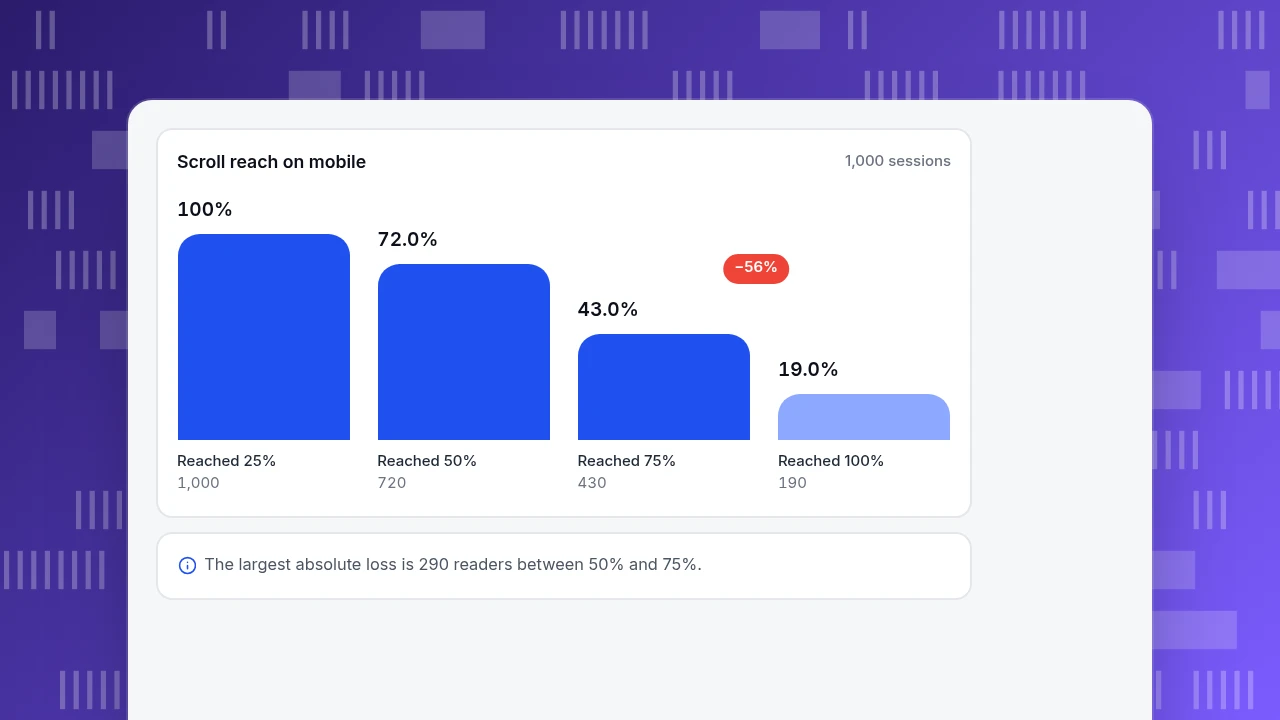
Sample data: 1,000 mobile sessions reached the first quarter of one article.
| Scroll reach | Sessions | Share of sessions | Drop from previous step |
|---|---|---|---|
| Reached 25% | 1,000 | 100% | n/a |
| Reached 50% | 720 | 72% | 28.0% |
| Reached 75% | 430 | 43% | 40.3% |
| Reached 100% | 190 | 19% | 55.8% |
Check one: (720 − 430) ÷ 720 = 40.3%. The steepest drop is between 75% and 100%, where 55.8% of those remaining leave, but the more informative one is 50% to 75%: you lose 290 readers there, the largest absolute loss in the funnel. Open the article at the point where the 50%-to-75% section sits and read it as a phone user. Typical culprits: a wide table that needs sideways scrolling, an embedded video that pushes text down, a long block with no subheading.
Treat the read layer as a diagnosis tool, not a score. A 19% finish rate on a 3,000-word guide may be fine if the answer sat at the top and most readers left satisfied. Pair it with a goal event (a sign-up or a click to the next article) to see whether the readers who left early still did what you wanted.
Scroll reach on mobile
1,000 sessionsReached 25%
1,000
Reached 50%
720
Reached 75%
430
Reached 100%
190
How do you tell whether mobile readers come back?
Returning is the layer that turns a read into an audience. Define it narrowly: the share of first-time mobile readers who return within 7 days.
Sample data: of 1,000 first-time mobile readers of the article in the last 30 days, 130 return within 7 days (13.0%). Desktop readers of the same article: 180 of 1,000 return (18.0%).
Two ways to use the gap. First, compare by entry source: readers who arrive from search often do not return unless something invites them (a related-article link, a sign-up); readers from email already know you. Second, track whether a change moves the rate. If a short sign-up prompt after 50% scroll raises 7-day return from 13.0% to 15.0%, that is 20 more returning readers per 1,000, which is a better test of that change than the sign-up count alone.
Keep the window and the definition fixed. Changing "7 days" to "14 days" makes any before-and-after comparison meaningless.
How different should the mobile numbers be from desktop?
Always compare devices side by side before you decide that content works or doesn't. Sample data for one month of one article category:
| Metric | Mobile | Desktop |
|---|---|---|
| Sessions | 6,200 (62%) | 3,800 (38%) |
| LCP, 75th percentile | 2.9 s | 1.8 s |
| Reached 50% scroll | 43% | 61% |
| 7-day return | 13.0% | 18.0% |
| Newsletter sign-ups per session | 0.90% (56 of 6,200) | 1.60% (61 of 3,800) |
Mobile brings most of the visits but the weakest outcomes at every layer. Combined numbers would show a middling 1.2% sign-up rate (117 of 10,000), hiding that mobile converts at roughly half the desktop rate. Fix order follows the layers: load first (2.9 s against 2.5 s), then the read drop, then the sign-up prompt.
One search-side reason to keep the devices comparable: Google uses the mobile version of a site's content for indexing and ranking, and its documentation says the mobile version should carry the same primary content, headings, structured data and metadata as the desktop version. If a mobile template hides a section behind a link, that section may not count as content for search at all.
Which mistakes make mobile content measurement misleading?
- Judging mobile by a responsive-design check. A page can look fine in a browser's phone preview and still load slowly on a mid-range phone over a weak network.
- Using the median or average for speed. The 75th percentile is the number the Core Web Vitals use; the median in the example looked good while the page failed.
- Reading bounce as "not interested". On a phone a reader can find the answer in one screen and leave satisfied.
- Merging devices. The combined 1.2% sign-up rate hides a 0.90% against 1.60% split.
- Ignoring tablets and in-app browsers. Readers who open your link from a social app see a different browser with its own limits; check whether that source behaves differently.
- Counting bots as readers. Crawler visits add sessions with no scroll and no return, which drags every layer down.
How do you measure mobile content in TapCub?
The article in the examples would be checked in TapCub like this. TapCub measures the content; it does not write, publish or send it, and it does not do email marketing.
- Split by device. Web analytics › Audience breaks visitors down by device type, screen size, browser and language. Add the mobile filter and open Web analytics › Pages to see views, average time on page, bounce rate, entries and exits for the article.
- Check load. Monitoring › Performance reports real-user LCP, INP and CLS with the same thresholds (2.5 s, 200 ms, 0.1). Switch the cards to the 75th percentile and the share rated good, break down by device and page, and read the slowest-pages list, which sorts by 75th-percentile LCP.
- Check reading. In All-platform analytics › Behavior › Heatmaps, open the page, choose mobile and the Scroll reach tab. Scroll reach stays empty until scroll depth is enabled in autocapture, which needs a plan that includes it.
- Check return. In All-platform analytics › Behavior › Behavior analysis, use retention for first-time readers of the page, and set a goal in Web analytics › Goals for the sign-up event so you can see the sign-up rate by device.
- In-app content. For articles inside an app, App analytics reports screens, custom events and engaged sessions (at least 10 seconds, or two screens, or one key event).
FAQ
What is mobile content marketing?
It is publishing content (articles, video, email, push and in-app messages) that is designed to be consumed on a phone. The measurement comes in three layers: whether the page loads fast, whether people read it and whether they return. Each layer should be checked on mobile data only, not combined with desktop.
How do you measure mobile content performance?
Use load (Core Web Vitals at the 75th percentile for mobile), read (scroll reach and goal events) and return (share of first-time readers back within 7 days). Compare against desktop for the same content. If load fails, fix it before judging the writing.
What is a good mobile page speed?
Google's Core Web Vitals call LCP of 2.5 seconds or less, INP of 200 milliseconds or less and CLS of 0.1 or less good, assessed at the 75th percentile of loads. The target is a share of loads passing, not one fast test.
Does mobile-first indexing change how you write content?
It changes what must be on the mobile page. Google uses the mobile version for indexing and ranking, so primary content, headings, structured data and metadata should match the desktop version. Collapsing text into accordions is fine; removing it is not.
Why is mobile engagement lower than desktop?
Often for fixable reasons: slower loads, tables and embeds that do not fit, long unbroken blocks and prompts that are hard to tap. In the sample, mobile reached 50% scroll for 43% of sessions against 61% on desktop. Start from the layer where the gap is largest.
Sources
- web.dev. Web Vitals — good thresholds for LCP (2.5 s), INP (200 ms) and CLS (0.1), assessed at the 75th percentile. Checked 2026-11-19.
- Google Search Central. Mobile-first indexing best practices — Google uses the mobile version of content for indexing and ranking; the mobile page should carry the same primary content, headings, structured data and metadata. Checked 2026-11-19.
Was this article helpful?
We use your answers to fix and expand this page.
Couldn’t send. Please try again in a minute.
Thanks for the feedback. We’ll use it to improve this page.You’ve already sent feedback on this page. Thanks.

Product Adoption Consultant
Explores customer onboarding, live conversations, and self-service, turning common usage questions into practical guidance and improvements.