Try it on your own data
Every report in this article is in the free plan. One snippet for web and apps, up to 10 sites.
Start freeA mobile marketing strategy is a plan for how a business reaches, converts and keeps customers on phones, and what numbers judge each channel. Choose that number before the channels: in the sample below, cost per install, per retained user and per payer each rank three channels in a different order, so the metric you pick decides where the money goes.
What you will learn
- Write each strategy part as a decision: goal, channels and budget, one number per channel, and a review rhythm
- Sample: paid social wins on cost per retained user ($6.67), search ads win on cost per payer ($66.67), and they look worst on cost per install ($4.00)
- Move a test share of budget (about 20% of the weakest channel) and check payer counts before cutting a channel
What is a mobile marketing strategy?
A mobile marketing strategy is a plan for how a business reaches, converts and keeps customers on their phones: which channels it uses, what it spends on each, and which numbers decide whether the spend worked. For an app business that means paid install campaigns, store listings, push and in-app messages, email and SMS. For a store or service it can also mean mobile web, text messages and social ads viewed on a phone.
Most plans written under this label are channel lists. They say where to be, not how to tell whether being there paid off. The test of a real strategy is that you can finish this sentence for every channel: "We will keep funding it if its cost per ___ stays under ___." This article is about choosing the blank, and about the measurement most teams are missing: what users do after the install.
The four parts: goal, channels, measurement, iteration
Every mobile strategy, from a two-person app to a large retailer, has the same four parts. Writing each one down in a sentence is enough to expose what is missing.
| Part | Question it answers | Example, written as a decision |
|---|---|---|
| Goal | What outcome are we paying for? | 1,800 users who come back the next day, not 5,750 installs |
| Channels | Where do we find those people, and with what budget? | Paid social, search ads and creator posts, $14,000 for the month |
| Measurement | Which number, taken from which source, judges each channel? | Cost per next-day-retained user; ad platform for spend and installs, analytics for retention |
| Iteration | What do we change when the number moves, and when do we look? | Review every second Monday; move 20% of the weakest channel's budget |
The goal comes first because it decides the measurement. "More installs" is a goal that every channel can hit, which is why it is a poor way to pick between channels. "More people who are still using the app tomorrow, or who pay" separates channels that look the same on an install report.
Pick one number per stage
The simplest scaffold is the AARRR funnel (acquisition, activation, retention, revenue, referral), which is defined on the AARRR page. Give each stage exactly one number and one source:
| Stage | Question | The number | Where it comes from |
|---|---|---|---|
| Acquisition | How many people did the spend bring, and at what price? | Installs; cost per install = spend ÷ installs | Ad platform, store console or attribution provider |
| Activation | Did they reach the point of the app? | Share of new users who do the key action within a day | Your own events; you choose the action |
| Retention | Do they come back? | Next-day and day-7 retention | Analytics |
| Revenue | Do they pay? | Payer rate = payers ÷ installs; return on ad spend = revenue ÷ spend | Order or purchase events plus spend |
| Referral | Do they bring others? | Shares or invites per active user | Your own events |
Two things trip teams up. First, acquisition numbers live in ad and store consoles, while the other four live in your own events, so nobody sees the whole chain unless someone joins them. Second, activation has no standard definition: if "key action" is never written down, the stage stays empty. For a longer list of app numbers and how they relate, see mobile app KPIs and app retention rate.
| Stage | Question | The number | Where it comes from |
|---|---|---|---|
| Acquisition | How many people did the spend bring, and at what price? | Installs; cost per install = spend ÷ installs | Ad platform, store console or attribution provider |
| Activation | Did they reach the point of the app? | Share of new users who do the key action within a day | Your own events |
| Retention | Do they come back? | Next-day and day-7 retention | Analytics |
| Revenue | Do they pay? | Payer rate = payers ÷ installs; return on ad spend = revenue ÷ spend | Purchase events plus spend |
| Referral | Do they bring others? | Shares or invites per active user | Your own events |
Acquisition numbers live in ad and store consoles; the other four live in your own events, so someone has to join them.
Worked example: three channels, three different winners
Sample data: one month, three paid channels for the same app. Spend and installs come from the ad platforms; next-day retention and payers come from the app's own analytics.
| Channel | Spend | Installs | Cost per install | Next-day retention | Retained users | Cost per retained user |
|---|---|---|---|---|---|---|
| Paid social | $6,000 | 3,000 | $2.00 | 30% | 900 | $6.67 |
| Search ads | $5,000 | 1,250 | $4.00 | 48% | 600 | $8.33 |
| Creator posts | $3,000 | 1,500 | $2.00 | 20% | 300 | $10.00 |
| All three | $14,000 | 5,750 | $2.43 | 31.3% | 1,800 | $7.78 |
Retained users are installs times retention, for example 3,000 × 30% = 900, and cost per retained user is spend divided by that, $6,000 ÷ 900 = $6.67. Now add the revenue stage:
| Channel | Payer rate (of installs) | Payers | Cost per payer | Payers per $1,000 spent |
|---|---|---|---|---|
| Paid social | 2.0% | 60 | $100.00 | 10.0 |
| Search ads | 6.0% | 75 | $66.67 | 15.0 |
| Creator posts | 1.0% | 15 | $200.00 | 5.0 |
| All three | 2.6% | 150 | $93.33 | 10.7 |
Read the three rankings side by side:
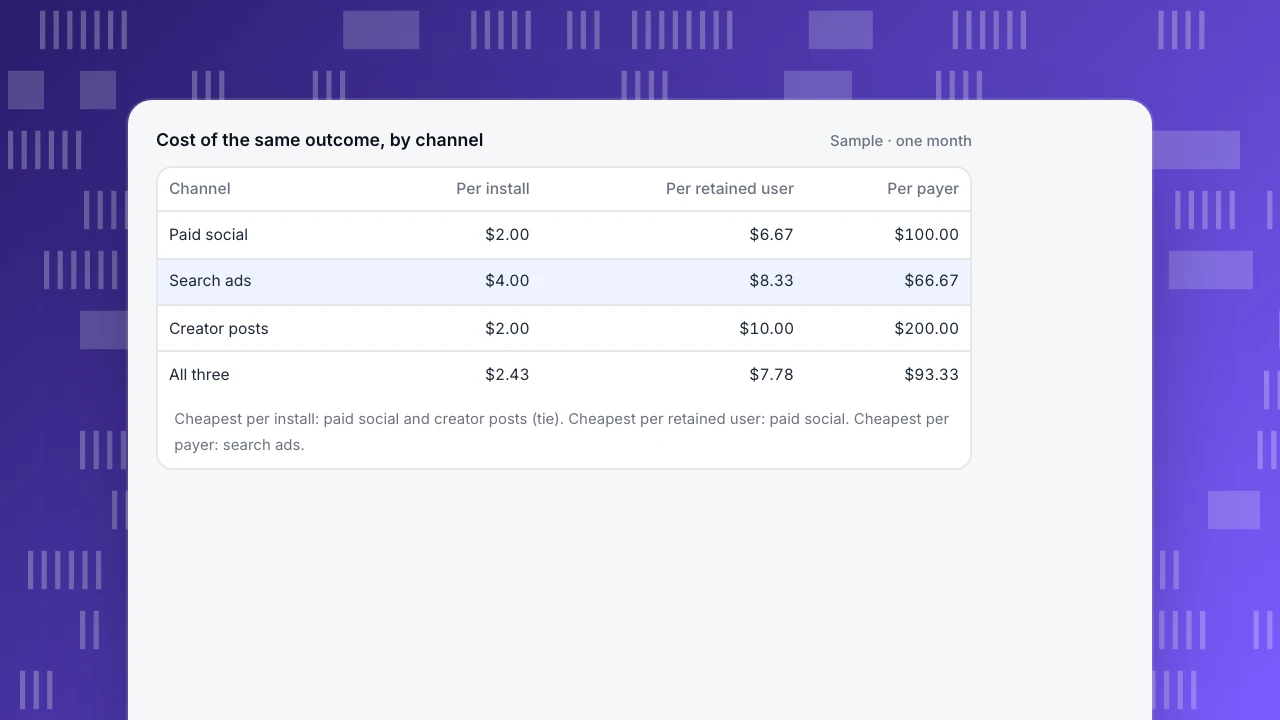
- By cost per install, paid social and creator posts tie at $2.00 and search ads look twice as expensive at $4.00.
- By cost per retained user, paid social wins at $6.67, search ads follow at $8.33 and creator posts are last at $10.00.
- By cost per payer, search ads win at $66.67, paid social is at $100.00 and creator posts cost three times as much as search ads at $200.00.
The channel that looks worst on installs is the cheapest way to get a paying customer, and the channel that ties for cheapest on installs is the most expensive. If the goal in your plan says "installs", the plan will send money the wrong way. This is the central point of a good strategy: the metric you choose is the strategy.
Cost of the same outcome, by channel
Sample · one month| Channel | Per install | Per retained user | Per payer |
|---|---|---|---|
| Paid social | $2.00 | $6.67 | $100.00 |
| Search ads | $4.00 | $8.33 | $66.67 |
| Creator posts | $2.00 | $10.00 | $200.00 |
| All three | $2.43 | $7.78 | $93.33 |
Cheapest per install: paid social and creator posts (tie). Cheapest per retained user: paid social. Cheapest per payer: search ads.
Turn the table into a budget decision
A table does not move money by itself. Three rules keep the decision honest:
- Match the number to the goal. If the goal is paying customers, rank by cost per payer. If the goal is an active base, rank by cost per retained user. Do not average the rankings.
- Move a test share, not the whole budget. Shift 20% of the weakest channel, here $600 from creator posts to search ads. At today's costs that is 9 payers instead of 3, six more. Costs usually rise as a channel scales, so treat six as the ceiling and measure after two weeks.
- Check the sample size before acting. Creator posts produced 15 payers from 1,500 installs, a 1.0% rate with a 95% range of roughly 0.5% to 1.5% (normal approximation). Paid social's 2.0% (60 of 3,000) ranges from about 1.5% to 2.5%, so the two ranges only just touch and one more month of data is worth having before you cut creator posts entirely. Search ads' 6.0% (75 of 1,250, about 4.7% to 7.3%) is clear of both.
Write down the review date and the threshold, for example "move budget if cost per payer differs by more than 25% for two consecutive reviews". It stops the plan being rewritten every time a weekly number wobbles.
Measure what happens after the install
"Mobile marketing analytics" is mostly the part of the chain after the ad platform stops reporting. Three habits close the gap:
- Send the events that define activation and revenue. Without a purchase or key-action event, the revenue and activation stages are blank, and every channel is judged on installs.
- Tag each user's channel at first open. If the app does not store where the user came from, retention can only be shown for the whole app and the table above cannot be built.
- Use the store's own acquisition numbers for the store. Apple defines conversion rate in App Store Connect as total downloads and pre-orders divided by unique device impressions, and Google Play Console reports store listing acquisitions as users who visited the listing and installed. Those numbers belong to the store; your own analytics starts when the app opens.
For organic and store-listing work, see the ASO guidelines article. Matching clicks to installs is the job of a mobile measurement partner and is not covered here.
Trends worth planning for: less user-level data
Trend lists tend to be opinions. Two changes are documented by the platforms and affect how a mobile plan is measured:
- Permission to track on iOS. From iOS 14.5, apps must receive the user's permission through App Tracking Transparency before they track them or access the device advertising identifier; without permission the identifier is all zeros (Apple). The practical effect is that user-level ad measurement depends on each user's choice, so plan on channel- and campaign-level numbers and on events you collect yourself.
- Install source from Google Play. The Play Install Referrer API provides the referrer URL of an installed package and the timestamps of the referrer click and of the install beginning (Android Developers). It tells your app where the install came from; it does not tell you whether the user stayed. That still needs your own retention events.
Both point the same way: put the measurement you control, the events inside your app, at the centre of the plan.
Common mistakes
- Choosing channels before the number. The channel list comes after "cost per ___ under ___".
- Judging on cost per install. In the sample, it ranks creator posts level with paid social and search ads last, the reverse of the payer ranking.
- Averaging across channels. The blended $93.33 per payer hides a $66.67 channel and a $200.00 one.
- Leaving activation unspecified. An empty activation stage means nobody knows whether the installs reached the app's point.
- Reading one week. Retention for the last days of a range is not yet due, so compare cohorts that have all had the same time to come back.
How to run this analysis in TapCub
Take the three channels above and work through them in TapCub.
- See retention by channel. If your SDK stores a channel value for each user, App analytics › Users › Channels shows average daily new users, next-day retention and share of active users for each channel, and plots them in a matrix so large, sticky channels stand out. New users here are people TapCub sees for the first time and a reinstall does not count, so the figure will differ from the installs your ad platform reports.
- Go past day one. In App analytics › Users › Retention, switch the grain to week or month, or to Active retention, and use the channel filter in the page header to see one channel at a time. Daily new-user retention reads a site-level summary that ignores the version and channel filters, so use the Channels page for next-day retention by channel. Retention is only filterable if the channel is on the event: pass
$channelin thetrackproperties, and users without it fall under (no channel). - Put spend next to results. In All-platform analytics › Business › Channel ROI, import spend on the Costs tab by day, channel, source and campaign (CSV or one row at a time). The page then shows cost per click (spend ÷ sessions), cost per acquisition (spend ÷ purchases on the order ledger) and return on ad spend (revenue ÷ spend), grouped by channel, source or campaign. The acquisition here is a purchase, not an install, so take cost per install from your ad platform.
- Map the AARRR stages. In All-platform analytics › Business › AARRR growth, set your signup, activation, payment and share events. Activation starts empty, so set it to a key action rather than a pageview. The page then lays the five stages side by side and shows which are still unmapped.
TapCub is not an attribution provider and does not match ad clicks to installs. If you use an attribution partner, its install postbacks can be received in TapCub and read next to behavior. For budget moves, a monitor in All-platform analytics › Operations › Monitors can tell you when a number crosses a threshold; it notifies only and changes no spend.
FAQ
What is a mobile marketing strategy?
It is a plan for reaching, converting and keeping customers on mobile devices: the channels you will use, the budget for each and the numbers that judge whether each channel worked. A plan that lists channels without a number and a threshold for each one is a channel list, not a strategy.
What are the key components of a mobile marketing strategy?
Four parts: a goal that names the outcome you are paying for, the channels and budget, the measurement that judges each channel, and the iteration rhythm that says what changes when the number moves. If one of the four cannot be written as a sentence, that is the part to fix first.
How do I measure mobile marketing performance?
Pick one number per stage of the user journey: installs and cost per install, a defined activation action, next-day and day-7 retention, payer rate or return on ad spend, and shares. Take acquisition numbers from the ad platform and the others from your own events, then join them by channel.
What is mobile marketing analytics?
It is the measurement of what mobile users do after an ad or listing brings them in: activation, retention and revenue, broken down by channel and app version. It complements ad-platform reports, which stop at the install and cannot tell you whether the user stayed or paid.
How do I split a mobile marketing budget between channels?
Rank channels by the cost of the outcome you want, such as cost per payer, then move a test share, around 20% of the weakest channel, and compare after two weeks. Do not rank by cost per install, which can point in the opposite direction.
See also: What is geofencing? Marketing, accuracy, consent and a worked test.
See also: Mobile Content Marketing: How to Measure Load, Reading and Return.
Sources
- Apple, User Privacy and Data Use (App Tracking Transparency from iOS 14.5; advertising identifier all zeros without permission). Checked 2026-11-17.
- Android Developers, Play Install Referrer API (referrer URL, click and install-begin timestamps). Checked 2026-11-17.
- Apple, Metric definitions, App Store Connect Analytics (conversion rate, impressions, downloads). Checked 2026-11-17.
- Google Play Console Help, Acquisition reports (store listing acquisitions). Checked 2026-11-17.
Was this article helpful?
We use your answers to fix and expand this page.
Couldn’t send. Please try again in a minute.
Thanks for the feedback. We’ll use it to improve this page.You’ve already sent feedback on this page. Thanks.

Product Experience Specialist
Explores usability, user journeys, and feature adoption through practical examples of onboarding and everyday product use.