Try it on your own data
Every report in this article is in the free plan. One snippet for web and apps, up to 10 sites.
Start freeMobile commerce (m-commerce) is buying and selling on phones and tablets instead of fixed computers. For a store it is best treated as a measurement question: phones often bring most of the sessions but far fewer of the orders. Compare traffic share with order share, split the funnel by device and fix the step that would add the most orders.
What you will learn
- Sample store: phones bring 71.4% of sessions but 46.2% of orders (1.1% vs 3.2% conversion); the blended 1.70% hides this
- Four funnel steps multiply to the overall gap (0.92 × 0.75 × 0.80 × 0.63 = 0.34); rank steps by extra orders, not by percentage points
- If mobile matched desktop only at checkout-to-order, the store gains 330 orders a month, more than any other single step
What is mobile commerce?
Mobile commerce (m-commerce) is conducting online transactions on portable wireless devices such as smartphones and tablets rather than on fixed computers. It is not a separate kind of business. It is the same shop, reached through a different device, with a different screen, a different keyboard and different patience. The practical consequence is that the same product page converts differently depending on what the shopper is holding.
That is why "mobile commerce" is more useful as a measurement question than as a trend. The first thing to know about your own store is how much of your traffic and how many of your orders come from phones, and whether those two shares match. When they do not, you have a mobile gap, and the rest of this article is about finding where it sits.
This article covers the whole mobile picture and how to measure it. Fixing individual screens is covered in mobile conversion rate optimization, and the in-app version of the metric is in mobile app conversion rate.
Where mobile commerce happens: mobile web, apps and mini programs
Shoppers reach your checkout through three different doors, and each one needs its own number:
| Where | How the shopper arrives | What breaks most often | What you measure |
|---|---|---|---|
| Mobile web (browser) | Search, ads, social links, email | Slow pages, long forms, no saved card | Sessions, funnel by device, page speed |
| Native app | Store install, push, deep link | Login walls, in-app browser handoffs | Screens, app versions, purchase events |
| Mini program (inside a super-app) | Scan, share, service account | Authorisation prompts, version lag | Scene values, shares, purchase events |
Two points follow from the table. First, "mobile conversion rate" is not one number: a shopper who browses in a mobile browser and buys in your app crosses two doors, so comparing browser sessions with app sessions is comparing different things. Second, all three should land in one orders record with a platform field, so you can compare them with the same definition of "order" rather than three dashboards that each count differently.
| Where | How the shopper arrives | What breaks most often | What you measure |
|---|---|---|---|
| Mobile web (browser) | Search, ads, social links, email | Slow pages, long forms, no saved card | Sessions, funnel by device, page speed |
| Native app | Store install, push, deep link | Login walls, in-app browser handoffs | Screens, app versions, purchase events |
| Mini program (inside a super-app) | Scan, share, service account | Authorisation prompts, version lag | Scene values, shares, purchase events |
Browser, app and mini program orders should land in one orders record with a platform field so they share one definition of an order.
Why mobile gets the traffic and desktop gets the orders
Sample data: one store, 30 days. Phones bring 50,000 sessions, desktop brings 20,000. Conversion is 1.1% on mobile and 3.2% on desktop.
- Desktop orders: 20,000 × 3.2% = 640
- Mobile orders: 50,000 × 1.1% = 550
- Blended conversion: (640 + 550) ÷ 70,000 = 1.70%
Mobile is 71.4% of sessions (50,000 ÷ 70,000) but 46.2% of orders (550 ÷ 1,190). That mismatch is the thing to explain. The blended 1.70% hides it completely: it would look like a mediocre store, when it is actually a good desktop store and a weak mobile one. Never judge a shop on the blended number before splitting by device.
Split the same month by step. The percentages are the share of the previous step, and the last column is the product of all four.
| Step | Desktop | Mobile | Mobile ÷ desktop |
|---|---|---|---|
| Sessions → product view | 60.0% (12,000) | 55.0% (27,500) | 0.92 |
| Product view → add to cart | 20.0% (2,400) | 15.0% (4,125) | 0.75 |
| Add to cart → checkout started | 50.0% (1,200) | 40.0% (1,650) | 0.80 |
| Checkout started → order | 53.3% (640) | 33.3% (550) | 0.63 |
| Overall | 3.2% | 1.1% | 0.34 |
The ratios multiply: 0.917 × 0.75 × 0.80 × 0.625 = 0.344, which is exactly 1.1 ÷ 3.2. Every step is a little worse on mobile, but the last one is far worse.
Find the step that costs the most orders
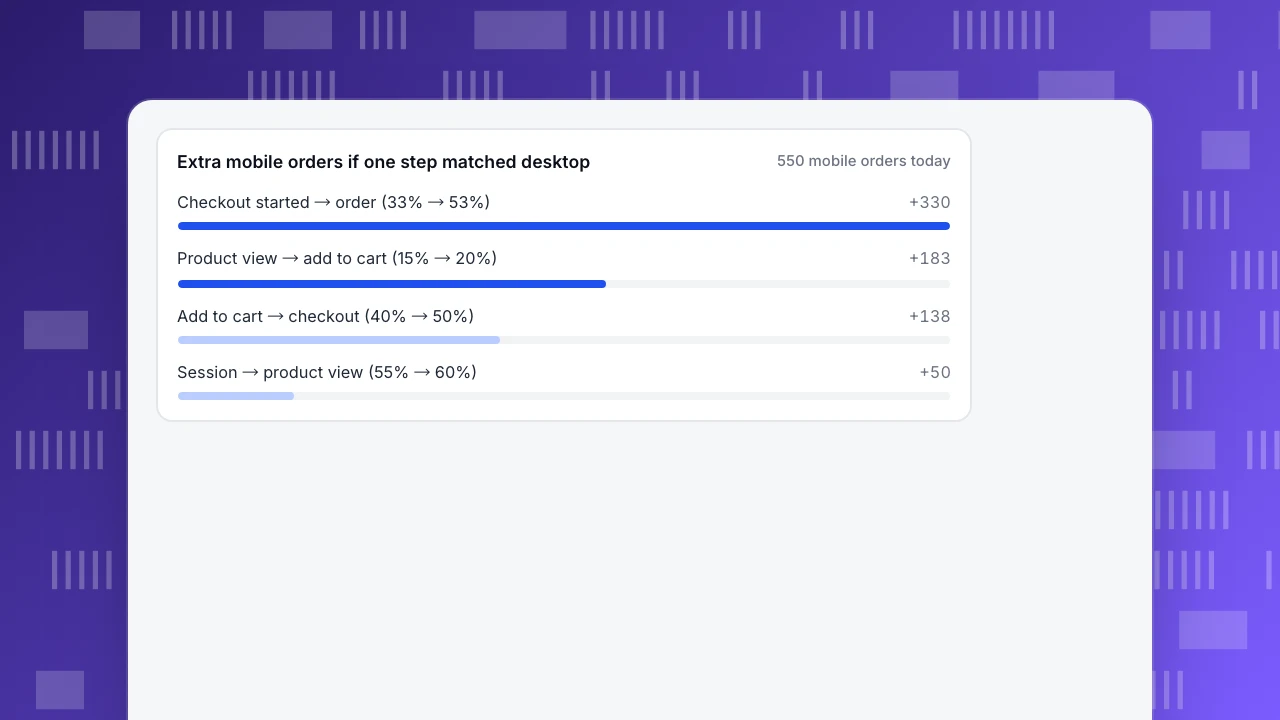
Rates alone do not say which step to fix first, because a step with a small rate gap but large volume can matter more. Ask a sharper question: if mobile matched desktop at only this step, how many extra orders would the month produce? Hold the other steps at their mobile values.
| If mobile matched desktop at… | Mobile rate → desktop rate | Orders | Extra orders |
|---|---|---|---|
| Product view | 55% → 60% | 600 | +50 |
| Add to cart | 15% → 20% | 733 | +183 |
| Checkout started | 40% → 50% | 688 | +138 |
| Order placed | 33.3% → 53.3% | 880 | +330 |
Each figure is 550 times the ratio of the two rates, for example 550 × 0.5333 ÷ 0.3333 = 880. The last step is worth 330 orders a month, the largest single lever; the other three are worth 50, 183 and 138. It is also the step with the most diagnosable causes, because it is a form and a payment rather than a catalogue. Closing all four gaps would give 50,000 × 3.2% = 1,600 mobile orders, 1,050 more than today.
The rule for your own data: rank the steps by extra orders, not by percentage-point gap, and start with the largest one that has a diagnosable cause.
Extra mobile orders if one step matched desktop
550 mobile orders todaySix places mobile checkouts lose shoppers
Once the funnel points at checkout, these are the usual suspects. Baymard Institute's survey of US shoppers who abandoned during checkout gives the share who cited each reason; those shares are not mobile-specific, so treat them as a checklist of causes, not a mobile benchmark. Shares add up to more than 100% because shoppers can give several reasons.
- Extra costs shown late (40% cited extra costs too high). Signal: a steep drop right after shipping or tax appears. Fix: show an estimate on the product page or cart.
- Forced account creation (18%). Signal: long time and many exits on the contact step. Fix: offer guest checkout, ask for a password after the order.
- Long or complicated forms (17%). Baymard counts 23.48 form elements in an average US checkout and recommends 12–14. On a phone every element is a tap, a keyboard opening and a scroll. Fix: cut optional fields, set the right keyboard type, and use
autocompletetokens such asemail,shipping postal-codeandcc-numberso the browser can fill the form (MDN reference). - Payment friction (declined card 10%, not enough payment methods 9%, distrust of card entry 19%). Signal: submitted payments without orders, or exits on the payment step for one device or country. Fix: offer the wallets and local methods your mobile shoppers already use, and give a clear retry path when a card fails.
- Errors and crashes (17%). Signal: a spike of errors on the checkout page after a release, often in one browser. Fix: monitor checkout errors by page and device, and test the checkout on real mid-range phones.
- Slow pages. Signal: poor load or interaction timings on checkout pages, worst on phones and on slower networks. Fix: see the next section.
For the full checkout-step method with a five-step example, read how to reduce checkout abandonment. For the shape of the wider funnel, see ecommerce funnel.
Mobile speed: measure it per device, then connect it to orders
Google's Core Web Vitals give three "good" thresholds, measured at the 75th percentile of page loads and reported separately for mobile and desktop: Largest Contentful Paint of 2.5 seconds or less, Interaction to Next Paint of 200 milliseconds or less, and Cumulative Layout Shift of 0.1 or less (web.dev). The split matters because a store can pass on desktop and fail on phones.
A Deloitte study run with Google across 37 European and American brand sites and over 30 million user sessions found that a 0.1-second improvement in mobile site speed was associated with an 8.4% rise in retail conversion rates. Two cautions come with that figure: the 0.1 second had to be gained across four speed metrics on every page of the journey, and it describes an association across many sites, not a promise for yours (web.dev case study).
The useful step for your store is local: break the performance report down by device, find the checkout and product pages with the worst 75th-percentile timings on phones, and check whether those same pages sit at the steps where your mobile funnel leaks.
How to measure mobile commerce so the numbers hold up
Four rules keep the mobile numbers comparable:
- Split by device before you judge anything. Report conversion, average order value and checkout completion for phone, tablet and desktop separately, and show each device's share of sessions next to its share of orders.
- Use the same event definitions on every platform. One name for "checkout started" and one for "order placed", so browser, app and mini program funnels can be laid side by side.
- Count orders from the server. A browser can lose a confirmation page on a slow connection. An order recorded when payment succeeds, with the order ID as the dedupe key, survives that.
- Choose people or sessions and keep it. A phone shopper who researches on Monday and buys on Wednesday on a laptop is two sessions and, unless they are logged in, two people. Logged-in identity is the only reliable way to join them.
Common mistakes
- Reading the blended rate. 1.70% hides a 3.2% desktop and a 1.1% mobile store.
- Fixing the product page first by habit. In the sample, the product-view step is worth +50 orders, the order step +330.
- Treating tablet as mobile or as desktop without checking. Look at it as its own row; it often behaves like neither.
- Comparing browser sessions with app sessions. App users chose to install your app, so they are a different audience from first-time browser visitors.
- Quoting an industry conversion average as your target. Averages mix categories, price points and traffic sources. Your own desktop-versus-mobile gap is the benchmark that applies.
How to find your mobile gap in TapCub
Take the sample store above and look for the same pattern in your own data.
- See the traffic-versus-orders mismatch. Web analytics and app analytics sit in the same project, and orders from web, app and mini program land in one ledger with a platform field. In All-platform analytics › Business › Commerce & revenue read orders, revenue, average order value and the cart abandon rate, then compare the platform split with your session split. Track ecommerce purchases shows how to send the purchase event from the server with an order ID.
- Build the funnel and split it by device. In All-platform analytics › Behavior › Behavior analysis, add a funnel with your view-item, add-to-cart, checkout and purchase events and break it down by device or platform. Each step shows its count, the rate against the previous step and the drop-off; the largest drop is marked. Read funnel drop-off explains each number.
- Count checkout form submissions without recording what people type. With
data-forms="true"on the script, Web analytics › Events shows form submissions with the form's id, name and action only, never the values (track form submissions). - Check phone speed and errors. Monitoring › Performance reports real-user timings with a breakdown by device, and Monitoring › Errors lists error groups with their pages, devices and last occurrence (find JavaScript errors).
TapCub measures the funnel; it does not run your checkout, offer wallets or run A/B tests. Use your store platform for those, then come back to the same funnel to see whether the order step moved. For the screen-level work, mobile UX covers what to change.
FAQ
What is mobile commerce?
Mobile commerce is buying and selling through portable wireless devices such as smartphones and tablets instead of fixed computers. It includes shopping in a mobile browser, buying in a native app and, in some markets, buying inside mini programs. It is a part of e-commerce, distinguished by the device and its limits.
What is the difference between m-commerce and e-commerce?
E-commerce covers online transactions on any device. M-commerce is the part done on mobile devices. For a store owner the difference is practical: phones bring more sessions, and shoppers there meet smaller screens, touch input and form fields that are slower to fill, so conversion is usually measured and fixed separately.
What are the types of mobile commerce?
By where the purchase happens: mobile web in a browser, native apps, and mini programs inside a larger app. Many store owners also count in-app purchases and mobile payments. For measurement the useful split is by platform, because each has a different entry point and a different checkout.
Why is my mobile conversion rate lower than desktop?
Usually because of the checkout, not the product: long forms, no autofill, limited payment options, slow pages or errors. Split your funnel by device and calculate how many extra orders each step would add if it matched desktop. In the sample here, the order step is worth 330 of 1,050 possible extra orders.
How do I measure mobile commerce?
Report orders, conversion and checkout completion per device, next to each device's share of sessions. Send orders from the server with an order ID, use the same event names on every platform and compare funnels step by step. Add real-user page speed by device to see whether slow pages sit where shoppers leave.
See also: Online Shopping Trends: How to Read Them and Test Them on Your Store.
Sources
- Encyclopedia of Management, Mobile Commerce (definition). Checked 2026-11-17.
- Baymard Institute, Cart Abandonment Rate Statistics (reasons for abandonment during checkout, US shoppers; form-element benchmark). Checked 2026-11-17.
- web.dev, Web Vitals (Core Web Vitals thresholds at the 75th percentile, mobile and desktop). Checked 2026-11-17.
- web.dev, Milliseconds make millions (Deloitte and Google study of 37 brand sites). Checked 2026-11-17.
- MDN Web Docs, HTML attribute: autocomplete. Checked 2026-11-17.
Was this article helpful?
We use your answers to fix and expand this page.
Couldn’t send. Please try again in a minute.
Thanks for the feedback. We’ll use it to improve this page.You’ve already sent feedback on this page. Thanks.

Product Experience Specialist
Writes about product experience, practical workflows, and growth, turning complex processes into clear steps for everyday decisions.