Try it on your own data
Every report in this article is in the free plan. One snippet for web and apps, up to 10 sites.
Start freeOnline shopping trends are shifts in how people discover, compare and buy products online, and most published numbers disagree because they measure different things. One Census quarter alone supports three honest headlines: 17.9% of retail, 10.4% growth year over year and 1.6% growth on the previous quarter. This guide gives a six-question checklist for any claim, the official figures, and a worked example that tests a mobile trend against a store's own data.
What you will learn
- Check the unit, whether it is a share or a growth rate, the period and who measured it before repeating any trend statistic
- One Census quarter supports three different headlines: a 17.9% share, 10.4% year-over-year growth and 1.6% quarter-over-quarter growth
- Test the trend on your own data: in the sample store mobile was 62.0% of sessions but only 44.9% of orders and 35.2% of revenue
Why do online shopping trend statistics disagree?
Online shopping trend numbers disagree because they answer different questions with different units. The same quarter of the same dataset can produce three honest headlines. The U.S. Census Bureau's estimate for the third quarter of 2026 puts retail e-commerce sales at $347.3 billion, seasonally adjusted and not adjusted for price changes, and the page supports all three of these statements:
- "E-commerce is 17.9% of retail" (a share: $347.3 billion of $1,941.9 billion).
- "E-commerce grew 10.4% year over year, against 5.6% for total retail" (a growth rate versus the same quarter of 2025).
- "E-commerce grew 1.6% from the previous quarter" (a short-term change).
Each is true, and each tells a different story: the share says online retail is established, the year-over-year growth says it is still outpacing stores, and the quarterly change says the near-term pace is modest. A trend article that quotes only one of them is selecting. Before you repeat a trend, find which of these it is, what it is measured against, and in which period.
What should you check before trusting a trend claim?
Six questions catch most weak claims:
| Question | What to look for | Red flag |
|---|---|---|
| What is the unit? | Sales, orders, sessions, or survey respondents | "Shoppers prefer X" with no unit |
| Share or growth? | A percentage of what, compared with when | A growth rate quoted as if it were a share |
| Which period? | Quarter or year, seasonally adjusted or not | No date, or a pre-2020 figure presented as current |
| Which people? | Country, age band, sample size, how recruited | A survey of a vendor's own customers |
| Who measured it? | Statistics agency, regulator, listed-company filing or a survey | A statistic repeated across blogs with no original page |
| What would change my mind? | A number from your own data that disagrees | A claim that cannot be checked at all |
Apply the table to anything you plan to act on. The most reliable sources are statistics agencies, regulators and primary research; most vendor round-ups cite a second-hand figure, so click through until you reach the page where the number was first published, and if you cannot reach it, do not use the number.
| Question | What to look for | Red flag |
|---|---|---|
| What is the unit? | Sales, orders, sessions or respondents | No unit stated |
| Share or growth? | A percentage of what, compared with when | Growth quoted as a share |
| Which period? | Quarter or year, adjusted or not | No date |
| Who measured it? | Agency, regulator, filing or survey | Repeated with no original page |
Four of the six checklist questions; the full list is in the article.
What do official figures say, and what do they not say?
Official figures measure total retail transactions, and that is both their strength and their limit. The Census Bureau's quarterly e-commerce figure is an estimate with stated margins of error (the page shows ±0.9 percent on the 10.4% annual growth). It reports sales, so it says nothing about conversion rates, traffic sources or whether shoppers used a phone. The page itself gives not-adjusted numbers ($335.7 billion, or 17.2% of retail, for the same quarter) next to adjusted ones.
How to use it: take the share and growth as context for the market you sell in, never as a target for your store. A store that grew 5% while U.S. e-commerce grew 10.4% lost relative position even though its own number rose. That comparison is only sound if you compare like with like, for example your total online sales growth against the headline rate, not one channel against it.
Which trends are people talking about, and what can you measure for each?
The recurring themes are mobile shopping, social discovery, AI-assisted shopping, delivery and returns expectations, subscriptions and omnichannel behaviour. A trend article tells you the theme; only your own data tells you whether it applies to you. For each, here is a measurable check:
| Trend theme | The claim | Check in your own data |
|---|---|---|
| Mobile shopping | More shopping happens on phones | Mobile share of sessions, of orders, of revenue |
| Social discovery | Shoppers find products on social platforms | Sessions and orders by social source, over time |
| AI-assisted shopping | Shoppers use AI tools to research and decide | Referral visits from AI answer engines; AI crawler activity separately |
| Delivery and returns | Shipping speed and returns policy decide purchases | Checkout abandonment by step, refund rate |
| Subscriptions | Repeat purchases on a schedule | Repeat purchase rate, orders per customer |
| Omnichannel | Customers use several channels before buying | Share of customers with more than one session source |
Treat the middle column as a hypothesis. The example below shows what testing one looks like.
Worked example: "most shopping is on mobile"
Take a claim you will see everywhere: shopping is shifting to phones. Test it against a sample store with 25,000 sessions in a month.
| Mobile | Desktop and tablet | Total | |
|---|---|---|---|
| Sessions | 15,500 (62.0%) | 9,500 (38.0%) | 25,000 |
| Conversion rate | 1.60% | 3.20% | 2.21% |
| Orders | 248 | 304 | 552 |
| AOV | $52 | $78 | |
| Revenue | $12,896 | $23,712 | $36,608 |
Calculations: 15,500 × 1.60% = 248 orders; 9,500 × 3.20% = 304 orders; 248 + 304 = 552 orders, 552 ÷ 25,000 = 2.21%. Revenue: 248 × $52 = $12,896; 304 × $78 = $23,712; total $36,608.
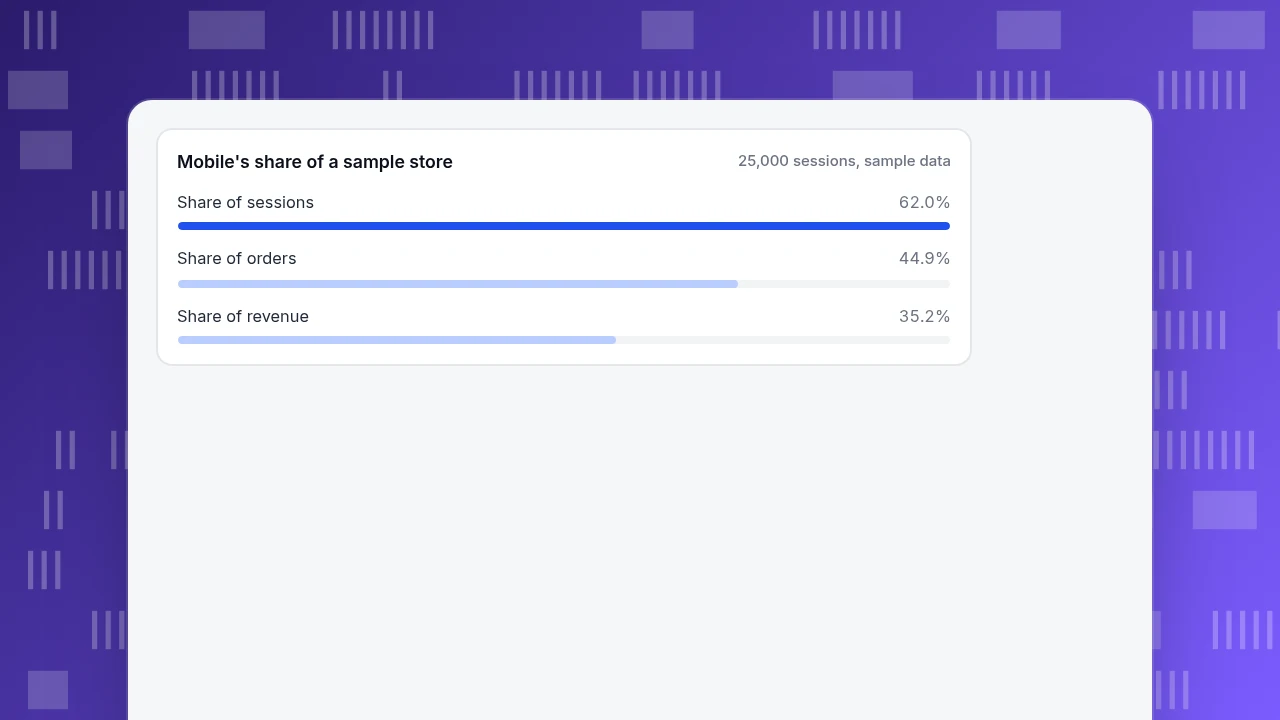
Mobile is 62.0% of sessions, but only 248 ÷ 552 = 44.9% of orders and $12,896 ÷ $36,608 = 35.2% of revenue. The headline "most of our traffic is mobile" is true; "most of our sales are mobile" is not, because mobile converts at half the desktop rate and its orders are smaller. What to do with that depends on a second question: is the mobile conversion gap a sign of a broken mobile checkout, or of people browsing on the phone and buying later on a laptop? A device-by-device funnel and a look at users who switch devices answer it; see mobile commerce for the mobile side in more detail.
Mobile's share of a sample store
25,000 sessions, sample dataHow do you test a trend against your own data?
Four steps, about an hour:
- Write the trend as a testable sentence. "Mobile's share of our orders is rising." Name the metric and the direction.
- Pull the same metric for at least four comparable periods. Same months across two years if the business is seasonal. A two-point comparison is not a trend.
- Split by the likely confounder. New versus returning customers, or channel mix, often explain a shift that looks like a behaviour change.
- Decide before you look what size of change would make you act, so a small movement does not become a story.
If your data does not show the trend, the trend is not your problem, however loudly it is written about. If it does, the next section decides what to do about it.
Which trends deserve a response?
Use three tests, all of which have to pass:
- Evidence: your own data shows the shift, not just an industry article.
- Reach: enough of your revenue sits in the affected group to matter. In the example above, mobile is 35.2% of revenue, so a mobile fix touches over a third of sales.
- Reversibility: the response is cheap to try and to undo. A checkout tweak is; a platform migration is not.
A trend that passes evidence and reach but fails reversibility deserves a small test first. A trend that fails evidence deserves a note in a file and a re-check next quarter, not a project. For how consumer behaviour examples translate into decisions, see consumer behavior examples.
Which mistakes do trend articles make easy?
- Mixing share and growth. "Online is 17.9% of retail" and "online grew 10.4%" are different claims.
- Ignoring adjustment. Seasonally adjusted and not adjusted figures can differ ($347.3 billion versus $335.7 billion for the same quarter).
- Copying a figure with no original page. If you cannot reach where it was published, do not repeat it. The much-repeated claim that acquiring a customer costs 5 to 25 times as much as keeping one is, in the Harvard Business Review article that cites it, given without a source and with a note that it varies by study and industry.
- Treating a survey of intentions as behaviour. What people say they will do is not what they bought.
- Applying market averages to your store. Your mix of channels and customers sets your numbers.
- Chasing every trend. Three tests above; if one fails, wait.
How to check a trend with TapCub
Take the mobile claim from the example. In TapCub:
- Read the device split. Web analytics › Audience shows visitors by device. Compare periods with the date-range comparison and annotate site changes under Configuration › Annotations so you can tell a trend from a redesign.
- Follow orders and revenue. All-platform analytics › Business › Commerce & revenue reads the order ledger once purchases are sent as events with an order ID and revenue; use it for revenue by period.
- Look at the funnel by device. In All-platform analytics › Behavior › Behavior analysis, build the funnel from item view to purchase and break it down by device, to see whether mobile loses people at checkout.
- Split social and AI traffic from the rest. Web analytics › Sources shows channel and source. Automated visits are tracked separately under Web analytics › Bots, whose AI & agents tab separates AI crawlers (reading your pages) from the human visits that follow, so crawler activity does not inflate your sessions.
TapCub shows your numbers. It does not provide industry benchmarks or forecasts; the comparison with the market comes from sources such as the Census page above.
FAQ
What are the current online shopping trends?
Commonly cited themes are mobile shopping, social discovery, AI-assisted shopping, delivery and returns expectations, subscriptions and omnichannel behaviour. Whether each applies to you is a question for your own data; the sample store above had 62.0% of sessions on mobile but only 35.2% of revenue.
How big is online shopping in the United States?
The Census Bureau's estimate for the third quarter of 2026 is $347.3 billion in retail e-commerce sales, seasonally adjusted, or 17.9% of total retail sales. Year over year, e-commerce grew 10.4% against 5.6% for total retail. The figures are estimates with margins of error, so read the latest release.
Where do I find reliable online shopping statistics?
Start with statistics agencies and regulators, then primary research with a stated sample and date. Be cautious with round-up pages that quote numbers without an original source; follow the link until you reach the page where the figure was first published.
Is mobile or desktop better for online shopping?
Neither by itself; it depends on what you measure. In the sample, mobile had 62.0% of sessions, 44.9% of orders and 35.2% of revenue. Compare conversion rate and order value by device in your own data before concluding anything.
How often should I review shopping trends?
Quarterly is enough for most stores. Pull the same few metrics for the same periods, note what moved, and act only on changes that pass the evidence, reach and reversibility tests.
Sources
- U.S. Census Bureau. Quarterly Retail E-Commerce Sales, 3rd Quarter 2026 — $347.3 billion (17.9% of retail, seasonally adjusted), +10.4% year over year versus +5.6% for total retail, +1.6% from the previous quarter; not adjusted $335.7 billion (17.2%). Read 2026-11-19.
- Gallo, A. The Value of Keeping the Right Customers. Harvard Business Review, October 2014 — an example of a widely repeated figure whose own article notes it has no original source. Read 2026-11-19.
Was this article helpful?
We use your answers to fix and expand this page.
Couldn’t send. Please try again in a minute.
Thanks for the feedback. We’ll use it to improve this page.You’ve already sent feedback on this page. Thanks.

Product Experience Specialist
Explores usability, user journeys, and feature adoption through practical examples of onboarding and everyday product use.