Try it on your own data
Every report in this article is in the free plan. One snippet for web and apps, up to 10 sites.
Start freeMobile UX is the overall experience of using your site or app on a phone — loading, touch, navigation and error recovery. Most problems can be found in data first: where taps miss, where scrolling stops, where pages lag. This guide gives the signals, thresholds and a worked example, then a rule for what to fix first.
What you will learn
- Find mobile UX problems in device-split data first: rage clicks for missed taps, scroll depth for content people never reach, LCP/INP/CLS at p75 for slow pages
- Two independent signals on the same element outrank one; within a tier, rank fixes by the number of affected mobile visitors
- Re-measure with the same goal and window after each fix; a before/after lift is observational, not an A/B result
What is mobile UX?
In product terms, mobile UX (mobile user experience) is the overall experience of using a website or app on a phone: how fast it loads, how reliably taps land, how easily people find their way around, and how they recover when something goes wrong. It is not the same as mobile UI, which is only the visual layer — the layout, the type, the buttons. A page can look polished and still fail on a phone because the main button sits below the point where most visitors stop scrolling, or because the largest image takes four seconds to appear on a mobile connection.
That kind of failure is measurable, and the thesis of this guide is simple: find mobile UX problems in the data first — where taps miss, where scrolling stops, where loading lags — then apply design principles. Principles tell you what good looks like. Your own analytics tells you which principle a page is breaking, on which device, and for how many visitors. The order matters: a redesign driven by principles alone often fixes the wrong thing.
Nielsen Norman Group's research on mobile use describes the constraints that make phone experiences different from desktop: a small screen, touch input that needs larger targets than a mouse, and attention that is fragmented by the environment. Each constraint leaves a signal you can measure:
| Mobile constraint (NN/g) | What it breaks on a phone | Signal to check |
|---|---|---|
| Small screen | Content and calls to action pushed below the fold | Scroll depth: share of visitors reaching 90% of the page |
| Imprecise touch input | Taps miss small targets or text that only looks tappable | Rage clicks per 1,000 visitors on the element |
| Fragmented attention | Slow pages lose people before they engage | LCP at the 75th percentile, mobile vs desktop |
The rest of this article walks through five common problems, a recomputable mobile-versus-desktop example, a rule for deciding what to fix first, and how to run the whole diagnosis in TapCub. If you are planning a new page rather than diagnosing an existing one, the mobile-first approach covers the design-order side.
Five mobile UX problems to check first
Each problem below has the same three parts: the data signal that reveals it, a threshold or decision rule with a source, and the first fix to try. Run them in this order on your highest-traffic mobile page, and always split the numbers by device — a site-wide average hides exactly the mobile-only failures you are looking for.
1. Touch targets people cannot hit
Signal. Rage clicks — repeated rapid taps on the same spot — cluster on one element. A rage click heatmap makes the cluster visible. In the example below, 30 rage clicks per 1,000 mobile visitors on a single label is not noise; it is people trying to tap something that does not respond.
Threshold. Interactive elements should be at least 1cm × 1cm (0.4in × 0.4in), per Nielsen Norman Group's touch-target research. Android's accessibility guidance sets the minimum touch target at 48dp × 48dp. Anything smaller — or anything that looks like a button but is plain text — will generate misses on a touchscreen.
First fix. Enlarge the target to at least 48dp, leave space between neighbouring targets so a thumb does not hit two at once, and turn text that behaves like a button into a real button element.
2. Forms that ask too much of a small keyboard
Signal. Form completion — submits ÷ form starts — split by device. When mobile completion sits far below desktop on the same form, the keyboard and the field count are the usual suspects, not the copy.
Rule. There is no published benchmark for form completion, so set your own line: if mobile submits ÷ starts falls below the level where the form pays for itself, cut fields before you redesign anything. Every removed field is one less keyboard switch and one less chance to abandon.
First fix. Remove optional fields, set the right input type (email, tel, number) so the phone shows the matching keyboard, and let autofill do the work it was designed to do.
3. Navigation borrowed from desktop
Signal. Scroll depth and second-page visits. If mobile visitors leave the homepage without reaching a second page, or scroll deep on one page without tapping anything, the menu is hiding the next step rather than the content being uninteresting.
Rule. Compare the share of mobile sessions that reach a second page against desktop on the same content. A large gap means the navigation is the problem, not the page.
First fix. Keep one primary action visible without opening a menu, and put everything else behind a single, clearly labelled button. Then watch whether second-page visits rise — that is the test, not the look of the menu.
4. Loading that loses the visit before it starts
Signal. Core Web Vitals from real users, split by device: LCP for loading, INP for responsiveness, CLS for visual stability. Lab scores on your own fast connection will not show what a phone on a cellular network experiences.
Threshold. Google's web.dev guidance: LCP ≤ 2.5 seconds, INP ≤ 200 milliseconds, CLS ≤ 0.1, measured at the 75th percentile of page loads and reported separately for mobile and desktop. A mobile LCP of 4.2 seconds fails the threshold even when desktop passes at 1.9 seconds — which is exactly the pattern in the example below.
First fix. Compress and correctly size the largest image or hero block; it is usually the LCP element. Then re-measure on real mobile traffic. Also check that web fonts and third-party scripts are not blocking the first render on phones.
5. Popups that cover the task
Signal. A scroll-depth cliff right after a popup appears, plus rage clicks on the close button. If the close target is smaller than 48dp, you have problem 1 living inside problem 5.
Rule. Compare exit rate on mobile sessions that saw the popup against sessions that did not, on the same page and the same window. If the popup group exits more, it is costing more attention than it earns.
First fix. Delay the popup until after the first scroll or a set dwell time, make the close target at least 48dp, and never let it cover the primary call to action. A consent or newsletter popup that blocks the whole screen on a phone is a conversion problem wearing a compliance costume.
The table below collects the five problems with their signals, thresholds and first fixes. For what each heatmap type actually shows and how to read one, see heatmap.
| Problem | Data signal | Threshold or rule | First fix |
|---|---|---|---|
| Touch targets | Rage clicks per 1,000 visitors on the element | >= 1cm x 1cm (NN/g); >= 48dp x 48dp (Android) | Enlarge to 48dp; make text that acts like a button a real button |
| Forms | Submits / form starts, by device | Below your own completion line, cut fields | Remove optional fields; match the keyboard to the input type |
| Navigation | Share of sessions reaching a second page; scroll depth | Mobile far below desktop on the same content | One visible primary action; the rest behind one labelled menu |
| Loading | LCP / INP / CLS at p75, by device | LCP <= 2.5s; INP <= 200ms; CLS <= 0.1 (web.dev) | Compress and size the LCP element; re-measure on real traffic |
| Popups | Scroll cliff after the popup; rage clicks on close; exit rate | Exit rate higher than sessions that did not see it | Delay the trigger; close target >= 48dp; never cover the CTA |
Thresholds from web.dev (Core Web Vitals, p75), NN/g and Android touch-target guidance; the form and popup rules are judgment calls on your own data, not published benchmarks.
Worked example: one page, mobile vs desktop
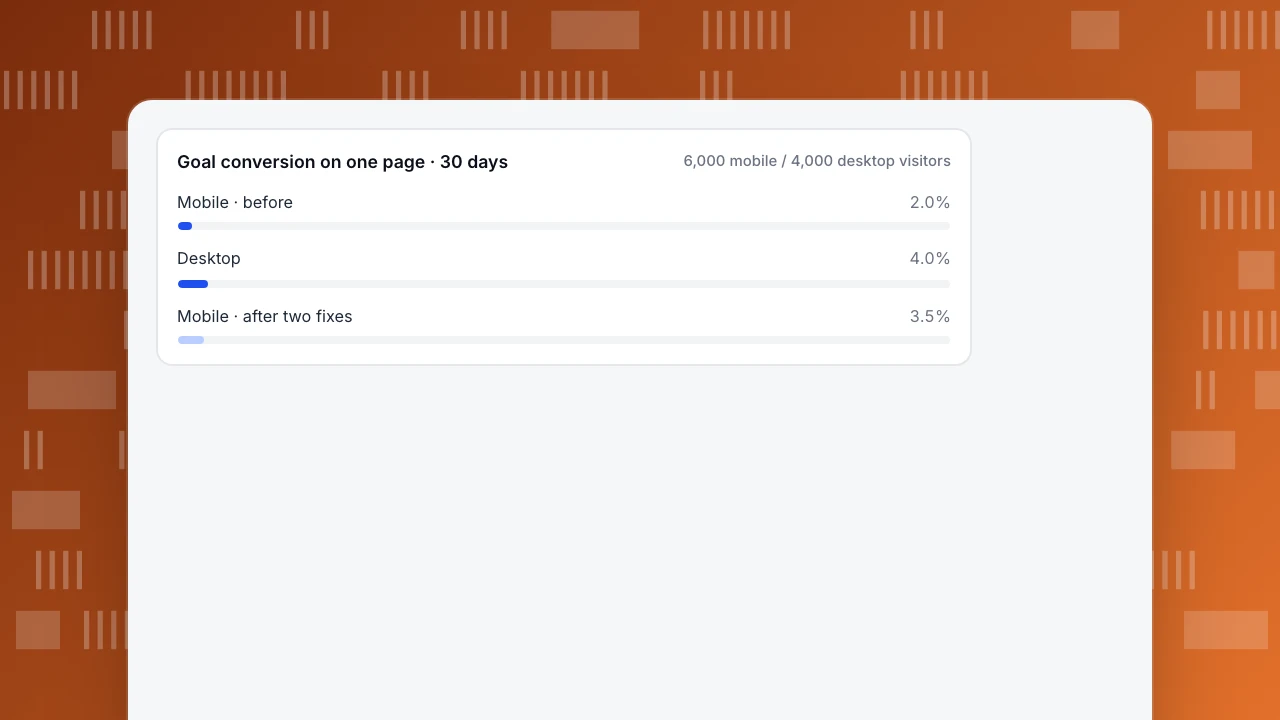
Sample data, one pricing page, 30 days. The page has a "Compare plans" label that looks like a button, a long feature table, and a large hero image. The goal is a click on "Compare plans". Every number below is recomputable from the raw counts, and the same goal definition is used before and after.
Before.
- Mobile: 6,000 visitors, 120 goal completions → 120 ÷ 6,000 = 2.0%.
- Desktop: 4,000 visitors, 160 completions → 160 ÷ 4,000 = 4.0%.
- Scroll ≥90%: mobile 1,500 ÷ 6,000 = 25%; desktop 2,200 ÷ 4,000 = 55%.
- Rage clicks on the "Compare plans" label: mobile 180, desktop 12 → 180 ÷ 6,000 × 1,000 = 30 per 1,000 mobile visitors, versus 12 ÷ 4,000 × 1,000 = 3 per 1,000 desktop visitors.
- LCP p75: mobile 4.2s, desktop 1.9s (threshold 2.5s).
Two independent signals point at the same element. The rage clicks say the label is being tapped and missed. The scroll heatmap shows a cliff at 40% of page height — and the label sits below that cliff, so three quarters of mobile visitors never even see it. The slow mobile LCP is a third, separate problem that compounds the first two: people who do wait for the page still cannot find the button.
The two fixes. (1) Turn the label into a real button of at least 48dp and move it above the 40% scroll cliff. (2) Compress the hero image; mobile LCP p75 drops from 4.2s to 2.4s, under the 2.5s threshold.
After — the next 30 days, same page, same goal definition:
- Mobile: 210 ÷ 6,000 = 3.5%; desktop unchanged at 4.0%.
- Scroll ≥90%: mobile 2,700 ÷ 6,000 = 45%.
- Rage clicks on the button: 22, about 3.7 per 1,000 visitors.
- Relative lift: 3.5 ÷ 2.0 − 1 = 75%. The mobile–desktop gap was 4.0 − 2.0 = 2.0 percentage points before; it is 4.0 − 3.5 = 0.5 points after.
| Metric (30 days) | Mobile before | Desktop | Mobile after |
|---|---|---|---|
| Goal conversion | 120/6,000 = 2.0% | 160/4,000 = 4.0% | 210/6,000 = 3.5% |
| Scroll ≥90% | 1,500/6,000 = 25% | 2,200/4,000 = 55% | 2,700/6,000 = 45% |
| Rage clicks per 1,000 | 30 | 3 | 3.7 |
| LCP p75 | 4.2s | 1.9s | 2.4s |
Read the result honestly. Both fixes shipped in the same window, so the 75% lift is their combined effect, and this is an observational before/after comparison, not an A/B test — traffic mix, seasonality and visitor intent can all move between two 30-day windows. For the conversion-side playbook (offers, CTA copy, checkout flow), see mobile conversion optimization; this article stays on finding experience problems. For how each metric above is defined and counted, see website KPIs.
Goal conversion on one page · 30 days
6,000 mobile / 4,000 desktop visitorsWhich fix should you ship first?
When several problems show up at once, two rules decide the order.
Rule 1: two independent signals beat one. If rage clicks and a scroll cliff both point at the same call to action, that element is confirmed broken from two directions. A single soft signal — say, a slightly low form completion rate — is a hypothesis, not a verdict. Fix the double-signal element first.
Rule 2: within the same tier, rank by affected mobile visitors. A problem on a page seen by 6,000 mobile visitors outranks the same problem on a page seen by 600. Multiply the failure rate by the mobile audience of the element, not by total site traffic; desktop visitors are not the ones missing the button.
Then ship one element per release and re-measure with the same goal definition and the same window. If you bundle two fixes, as in the example above, you can report the combined lift but you cannot split it between them.
| Priority | Fix | Evidence | Why it ranks here |
|---|---|---|---|
| 1 | "Compare plans" button: ≥48dp, above the scroll cliff | Rage clicks 30/1,000 plus a scroll cliff at 40% — two signals | Every one of the 6,000 mobile visitors meets this element |
| 2 | Compress the hero image | Mobile LCP p75 4.2s > 2.5s — one signal, but a hard threshold | Affects every mobile page load, yet only one signal points here |
| 3 | Shorten the signup form | Mobile submits ÷ starts below your own line — one soft signal | Only visitors who reach the form are affected |
The thesis again, because it is the whole method: find where taps miss, where scrolling stops and where loading lags in your data first; design principles come second. The principles told us targets should be 48dp and pages should load within 2.5 seconds. But only the rage-click heatmap and the scroll cliff told us which element to fix, and only the device split told us how many people it was costing. For turning these signals into a standing measurement routine rather than a one-off audit, see UX analytics.
How to run this diagnosis in TapCub
The example above is one page and two fixes. Here is the same diagnosis in TapCub, in five steps, with the same numbers: find the problem in the data first, then pick the design fix.
- Split the goal by device. In Web analytics › Goals, break the "Compare plans" goal down by device: 120 conversions from 6,000 mobile visitors against 160 from 4,000 desktop visitors. Web analytics › Audience shows how much of the page's traffic is mobile in the first place. Bots are counted separately in Web analytics › Bots, so crawlers do not inflate the visitor counts you divide by.
- Read the heatmaps on mobile. In All-platform analytics › Behavior › Heatmaps, pick the pricing page, set the device to mobile and switch between Clicks, Rage clicks, Scroll reach and Elements: the 180 rage clicks on the label and the cliff at 40% show up here. Heatmaps need autocapture (Pro plan or higher), and scroll reach stays empty until Scroll depth is turned on in autocapture; create a heatmap walks through the setup.
- Confirm with session replay. All-platform analytics › Behavior › Session replay is off by default. An admin turns it on in its Settings tab after confirming that the privacy policy covers recording and that input masking stays on. Then watch a few mobile sessions where the tap lands beside the label instead of on it.
- Check real-user speed and errors by device. Monitoring › Performance breaks Core Web Vitals down by device, so mobile LCP at P75 (4.2s against the 2.5s threshold) sits next to desktop (1.9s). If INP is the slow metric instead, minimize main thread work covers the fix. Monitoring › Errors shows error rate (errors ÷ pageviews) and a frustration table of pages with rage clicks and error clicks, which catches a button that throws a script error when tapped.
- Re-measure and mark the release. Add the release date in Configuration › Annotations so charts show where "before" ends, then read the same goal by device over the next 30 days: 210 of 6,000 = 3.5%.
For a native app, the iOS, Android, Flutter, React Native and HarmonyOS SDKs record screens in the same project, and paths and funnels in All-platform analytics › Behavior › Behavior analysis apply the same drop-off logic to screens instead of pages.
Two boundaries worth stating plainly. TapCub does not run A/B tests, so the before/after above stays observational rather than experimental. And session replay has to be turned on deliberately, with the privacy-policy check above; it does not quietly record visitors by default.
FAQ
What is the difference between mobile UX and mobile UI?
Mobile UI is the visual layer: layout, typography, buttons and colour. Mobile UX is the whole experience of using the site or app on a phone, including loading speed, touch accuracy, navigation and error recovery. A beautiful UI can still deliver poor UX if the main button is unreachable or the page takes four seconds to load — which is why UX problems are found in behaviour data, not in a design review.
How do you measure mobile UX?
Start with behaviour data split by device: scroll depth, rage clicks per 1,000 visitors, and goal conversion on the same page, mobile versus desktop. Add real-user Core Web Vitals — LCP, INP and CLS at the 75th percentile. That order matters: find where taps miss, where scrolling stops and where loading lags first, then use design principles to decide the fix.
What are the main mobile UX design principles?
Keep touch targets at least 48dp (about 1cm), minimise typing with the right keyboards and autofill, keep navigation to one visible primary action, load the main content within 2.5 seconds, and keep key content above the point where most visitors stop scrolling. Treat each principle as a hypothesis: your heatmaps and device-split metrics tell you which one your page is actually breaking.
What are the most common mobile UX mistakes?
The five covered above: touch targets too small to hit, forms that ask too much of a phone keyboard, navigation copied from desktop, slow loading that misses the 2.5-second LCP threshold, and popups that cover the task. Each leaves a trace — rage clicks, form drop-off, shallow scroll depth, a failed LCP, early exits — so you can find them before redesigning anything.
Is mobile app UX the same as mobile website UX?
The constraints are the same — small screen, imprecise touch, fragmented attention — and so are the signals: missed taps, drop-off screens, slow starts. Apps add installation, offline states and platform conventions, and you measure screens and events through an SDK instead of pageviews. The diagnosis order does not change: data first, then design.
See also: Mobile Search Engine Optimization: Rendering, Speed and Tap Checks.
Sources
- web.dev. Web Vitals — LCP ≤ 2.5s, INP ≤ 200ms, CLS ≤ 0.1 at the 75th percentile, segmented mobile and desktop. Verified 2026-11-15.
- Harley, A. (2019). Touch Target Sizes. Nielsen Norman Group — interactive elements at least 1cm × 1cm (0.4in × 0.4in). Verified 2026-11-15.
- Android Developers. Make apps more accessible — touch targets at least 48dp × 48dp. Verified 2026-11-15.
- Budiu, R. (2015). Mobile UX. Nielsen Norman Group — small screens, touch input and fragmented attention as mobile constraints. Verified 2026-11-15.
Was this article helpful?
We use your answers to fix and expand this page.
Couldn’t send. Please try again in a minute.
Thanks for the feedback. We’ll use it to improve this page.You’ve already sent feedback on this page. Thanks.

Product Experience Specialist
Writes about product experience, practical workflows, and growth, turning complex processes into clear steps for everyday decisions.