Try it on your own data
Every report in this article is in the free plan. One snippet for web and apps, up to 10 sites.
Start freeWebsite KPIs are the few numbers that show whether your site is doing its job — chosen by working backward from that job, not from what your analytics can count: one primary KPI plus three to five metrics that explain it. Here is how to pick them, keep bots out of the denominators, and set targets from a 90-day baseline.
What you will learn
- Derive KPIs from the website's job: one primary KPI plus 3–5 metrics that explain it; everything else is diagnostics
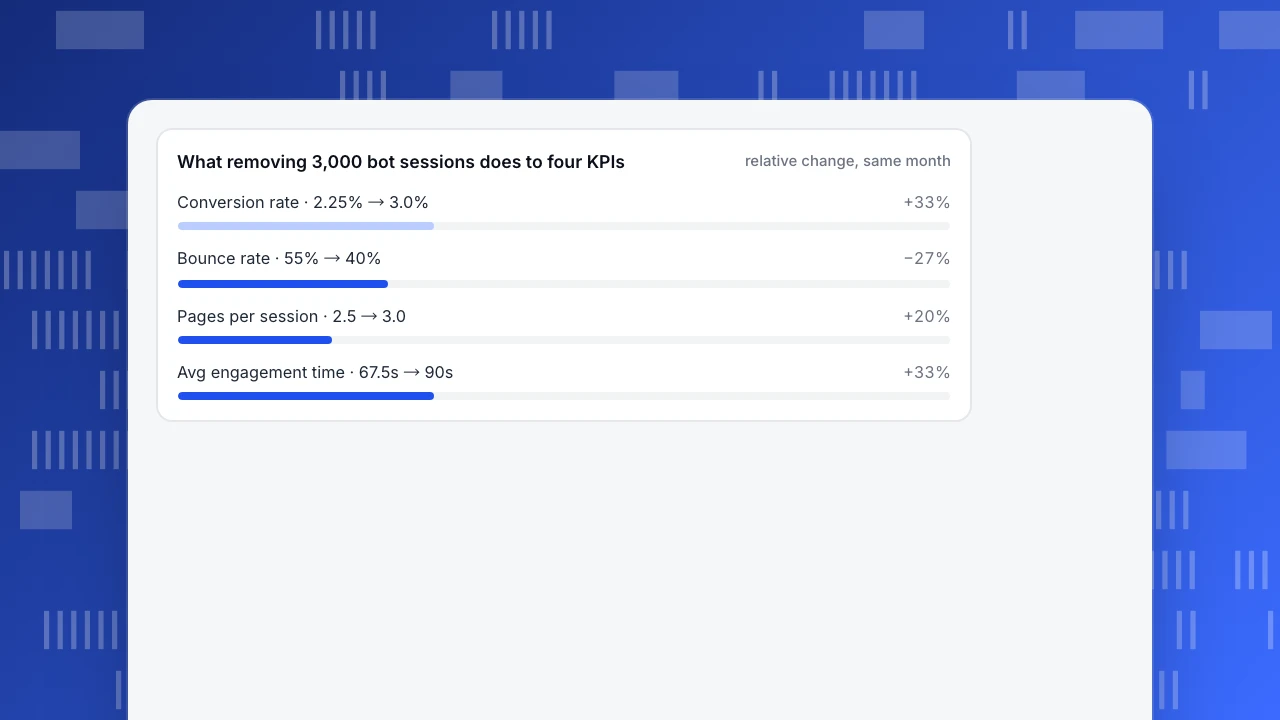
- Compute rates on human sessions only: in the sample month, removing 3,000 bot sessions moves conversion rate from 2.25% to 3.0%
- Set targets from a 90-day baseline: 2.5% to 3.0% is +20% relative, worth 135 extra orders on 27,000 forecast sessions
What is the difference between a website KPI and a metric?
A website KPI is a metric attached to a goal, with a target, an owner and a review cadence. A metric is any number your analytics can count. Sessions, pageviews, bounce rate, scroll depth: all metrics. They become KPIs only when someone decides "this number tells us whether the site is doing its job, and here is what we will do if it moves."
The distinction is not academic. GA4 lets any collected event become a key event — an action "particularly important to the success of your business" (About key events). The tool will happily mark thirty numbers as important. The goal has to do the filtering. The general distinction is covered in metrics vs KPIs; here it is applied to a website.
Decision rule: if a number moves and nobody changes a decision, it is a metric, not a KPI. Apply it to three numbers from the sample store we will use throughout this article:
| Number | Verdict | Why |
|---|---|---|
| 12,000 sessions this month | Metric | No goal attached; context, not a verdict on the business |
| Purchase conversion rate against its target | Primary KPI | Proves the site's job (selling); has a target, an owner, a weekly review |
| Bounce rate on the checkout page | Diagnostic metric | Explains the KPI when it moves; opened on demand |
How do you choose KPIs from the job your website has to do?
Do not start from the list of things your analytics can count. Start from the one job the website exists to do and derive the numbers backward: one primary KPI, three to five metrics that explain it, everything else diagnostics. Four steps on the sample store:
- Write the job in one sentence. "This site sells kitchen equipment to people who arrive from search and email." If you cannot write the sentence, you cannot pick KPIs — that is a strategy problem, not a measurement problem. Website goals come before website metrics.
- Pick the one number that proves the job happens. For the store: purchase conversion rate = orders ÷ human sessions (conversion rate). One number, because two primaries means no primary.
- Add three to five explainers. When the rate moves, these say why: human sessions by source (traffic quality), engagement rate (did the visit mean anything), checkout completion rate (where orders die), average order value (what an order is worth).
- Demote everything else to diagnostics. Page-level bounce, error rate, device split, scroll depth: open them only when a KPI or an explainer moves. They are the toolbox, not the weekly review.
The result is five numbers in the weekly review instead of forty. Marketing-level KPIs such as pipeline, acquisition cost and channel ROI sit above this tree and are a separate derivation — see marketing KPIs.
Which KPIs fit each type of website?
Same derivation, four common jobs. The table below gives each site type a primary KPI, its explainers and typical diagnostics. Treat it as a starting point, not a checklist: swap any row that does not match your job.
The ecommerce tree is the sample store's tree: purchase conversion rate, explained by sessions by source, engagement rate, checkout completion and average order value, with diagnostics underneath. Cart abandonment, revenue per visitor and repeat-purchase detail live in ecommerce KPIs.
Content sites live on returning engaged readers. Engagement rate = engaged sessions ÷ total sessions, and GA4 counts a session as engaged when it lasts 10 seconds or longer, has 1 or more conversion events, or 2 or more pageviews (dimensions and metrics). The traffic-side explainers are search CTR — clicks ÷ impressions — and average position, as Search Console defines them; turning those into a page-level fix list is covered in the keyword performance report.
SaaS sites run on signup conversion rate, explained by activation and trial-to-paid rates; lead-gen sites run on visitor-to-lead rate, and the lead-to-qualified step happens in the CRM, not in web analytics. If your site serves long-cycle B2B buying committees, account-level metrics change the tree — see B2B website metrics; this article stays with the general method.
| Website type | The job → primary KPI | Supporting KPIs (3–5) | Diagnostics (on demand) |
|---|---|---|---|
| Ecommerce | Sell products → purchase conversion rate (orders ÷ human sessions) | Human sessions by source; engagement rate; checkout completion rate; average order value | Checkout step drop-off; error rate; page-level bounce |
| SaaS | Start qualified trials → signup conversion rate | Activation rate; trial-to-paid rate; time to first value; signups by source | Feature adoption events; pricing page exits; form errors |
| Content | Build a returning audience → weekly returning engaged readers | Engagement rate; pages per engaged session; newsletter signup rate; search CTR | Impressions and average position; top exit pages; crawl anomalies |
| Lead gen | Deliver qualified leads → visitor-to-lead conversion rate | Lead-to-qualified rate (CRM); form completion rate; cost per lead; lead response time | Form abandonment; landing page bounce; source mix |
One primary KPI per site, 3–5 explainers, diagnostics opened only when a KPI moves. Swap any row to match your actual job.
Why do bots change your KPI numbers?
Sample data, one store month. The raw counts:
- 12,000 sessions: 9,000 human + 3,000 identified bots
- 270 orders, all from human sessions
- 6,600 bounced sessions: 3,600 human + 3,000 bot (every bot session bounced)
- 30,000 pageviews: 27,000 human + 3,000 bot (one page per bot session)
- 810,000 engaged seconds, all human (bots contribute zero)
Recomputed both ways:
| KPI | Bots included (12,000 sessions) | Humans only (9,000 sessions) |
|---|---|---|
| Conversion rate | 270 ÷ 12,000 = 2.25% | 270 ÷ 9,000 = 3.0% |
| Bounce rate | 6,600 ÷ 12,000 = 55% | 3,600 ÷ 9,000 = 40% |
| Pages per session | 30,000 ÷ 12,000 = 2.5 | 27,000 ÷ 9,000 = 3.0 |
| Avg engagement time | 810,000 ÷ 12,000 = 67.5s | 810,000 ÷ 9,000 = 90s |
Align the definitions first: bounce rate is the share of sessions that were not engaged — GA4 puts it as non-engaged sessions ÷ total sessions (dimensions and metrics) — and a session is a period during which a user interacts with the site (About Analytics sessions). Whatever tool you use, ask one question: are identified bots in the denominator? This month they inflate sessions by a third (3,000 ÷ 9,000) while adding zero orders, zero engaged seconds and one pageview each, so every ratio drifts.
Nothing real changed between the two columns: same store, same month, same 270 orders. The primary KPI moved from 2.25% to 3.0%, a third higher, purely on the denominator. That is the test of a KPI: you must be able to state what is in the denominator. If you cannot, the number is not a KPI yet. A crawler wave can make conversion rate "collapse" in a report without a single human behaving differently.
What removing 3,000 bot sessions does to four KPIs
relative change, same monthHow do you set a KPI target you can defend?
Sample data, same store. Four steps of arithmetic:
- Baseline. Past 90 days: 600 orders ÷ 24,000 human sessions = 2.5%. The denominator uses exactly the same definition as the KPI.
- Target. 3.0%. Relative change: 3.0 ÷ 2.5 − 1 = +20%. Say it out loud as "a fifth more orders per session", not "half a point".
- Forecast. Next quarter, 27,000 human sessions expected from current source trends. At target: 27,000 × 3.0% = 810 orders. At baseline: 27,000 × 2.5% = 675. The gap is 135 orders.
- Money. At an $80 average order value, the target quarter is 810 × $80 = $64,800, versus 675 × $80 = $54,000 at the old rate — the $10,800 difference is what the target is actually asking for.
Three rules make the target defensible: the baseline uses the same clean denominator as the KPI; one primary target at a time, so trade-offs stay visible; and the arithmetic is written down, so anyone can recompute it and argue with the assumption (27,000 sessions) instead of the conclusion. A target without a baseline is a wish. Reset the baseline quarterly.
Where the numbers live matters less than whether someone opens them; KPI dashboards covers layouts that actually get read.
What are the most common website KPI mistakes?
Four mistakes show up again and again in KPI spreadsheets:
| Mistake | What it looks like | Fix |
|---|---|---|
| Vanity metrics as KPIs | Pageviews up, orders flat | Demote to diagnostics; a KPI must prove the job |
| Bots in the denominator | Conversion rate "drops" after a crawler wave | Separate identified bots; recompute on human sessions |
| Too many KPIs | Two dozen numbers on the weekly slide, no owners | One primary plus 3–5 explainers; the rest on demand |
| Targets without a baseline | "Double conversions next quarter" | 90-day baseline → relative target → order gap, in writing |
Every fix is the same move: start from the job the website has to do, keep one primary KPI and the three to five metrics that explain it, and treat everything else as diagnostics. The list of available metrics is endless; the job is one sentence.
How do you run this KPI setup in TapCub?
The sample store in TapCub: the same month, 9,000 human sessions, 270 orders and a 3.0% primary KPI, in four steps.
- Define the order once, and know which rate you read. In Web analytics › Goals, make the order-confirmation event (or the thank-you page) a goal; one event or page counts as one conversion, and All-platform analytics › Business › Goals reads the same data. TapCub shows two conversion rates. The goal conversion rate on Goals divides distinct visitors who converted by distinct visitors; the conversion rate on Web analytics › Reports divides conversions by sessions. The store's KPI, orders ÷ human sessions, is the second one: 270 ÷ 9,000 = 3.0%. Write that into the KPI definition so nobody compares the two.
- Keep the 3,000 bot sessions out of the denominator. New projects default to Detect and report separately: recognised bots are excluded from human visitors, sessions and pageviews and appear only on Web analytics › Bots. The 2.25% column from the bot section never reaches your reports, and when a crawler wave hits, the Bots report shows which crawler it was instead of a "collapse" in conversion rate.
- Read the explainers next to the KPI. The breakdown on Goals splits conversions by source, entry page, country and device, the traffic-quality explainer. Web analytics › Reports carries engaged rate (a session of 10 seconds or more, or 2 or more pageviews), bounce rate (one pageview and no custom event) and pages per session, all over human sessions. For a KPI the built-in reports lack, such as revenue per human session, define a formula metric in All-platform analytics › Behavior › Metrics & SQL.
- Alert on explainers, not on everything. In All-platform analytics › Operations › Monitors, put a daily check on bounce_rate or on the saved revenue-per-session metric. A dry run calculates without sending and tells you how many times the rule would have fired in the past 30 days, so you can tune the threshold first. Mark checkout changes in Configuration › Annotations so next quarter's baseline comparison carries its explanation.
What TapCub does not do: it measures. A monitor only notifies and never acts for you; TapCub does not run the A/B test that moves the KPI, and a lead-gen site's lead-to-qualified step stays in the CRM.
FAQ
What is a website KPI?
A website KPI is a metric tied to the job the site must do, with a target, an owner and a review cadence — for a store, purchase conversion rate on human sessions. Everything else your analytics counts is a metric: useful for explaining the KPI, but not a verdict on the business by itself.
How many KPIs should a website have?
One primary KPI plus three to five explainers, so five to six numbers in the weekly review. More than that and nobody owns anything: when every number is a KPI, no number is. Keep the rest as diagnostics you open only when a KPI moves, and resist adding a number just because the tool can count it.
What is the most important website KPI?
Whichever one proves the site's job — there is no universal answer. A store lives on purchase conversion rate, a lead-gen site on visitor-to-lead rate, a SaaS site on signup conversion, a content site on returning engaged readers. Derive it from the job first; the "most important" label follows the job, not the tool's default report.
Are sessions and pageviews KPIs?
Usually not. They are website traffic metrics: context and explainers, not verdicts. Sessions become KPI-like only when tied to a goal, for example qualified sessions from a campaign with a target. Pageviews alone reward volume, not value. Watch them beside the primary KPI, and never let a traffic spike count as success without orders, leads or engaged readers behind it.
How often should you review website KPIs?
Weekly for the primary KPI and its explainers, monthly for target-versus-baseline progress, quarterly to reset the baseline and the target itself. Between reviews, let monitors watch bounce rate and error rate so a broken checkout does not wait for Monday. The cadence matters less than having a named owner who reads the numbers and decides.
Sources
- Google Analytics Help, Analytics dimensions and metrics — bounce rate, engaged session and engagement rate definitions.
- Google Analytics Help, About key events — any collected event can be marked as a key event.
- Google Analytics Help, About Analytics sessions — session definition and timeout.
- Google Search Console Help, What are impressions, position, and clicks? — CTR and average position definitions.
- Matomo Core Team, What Are Website KPIs (10 KPIs and Best Ways to Track Them) — the ten-metric list this article argues you should filter by job.
Was this article helpful?
We use your answers to fix and expand this page.
Couldn’t send. Please try again in a minute.
Thanks for the feedback. We’ll use it to improve this page.You’ve already sent feedback on this page. Thanks.

Product Analyst
Focuses on event analysis, conversion funnels, and retention, using clear metric definitions and structured analysis to explain product performance.