Try it on your own data
Every report in this article is in the free plan. One snippet for web and apps, up to 10 sites.
Start freeA keywords performance report tells you which page to change next: read queries by page and click-through rate by rank bucket, not as a flat keyword list. This guide gives a nine-column template, a fully recomputable 20-query example, and a monthly cadence that ends in a decision.
What you will learn
- Read queries by page and CTR by rank bucket — the report's job is to name the next page to change, not to list keywords
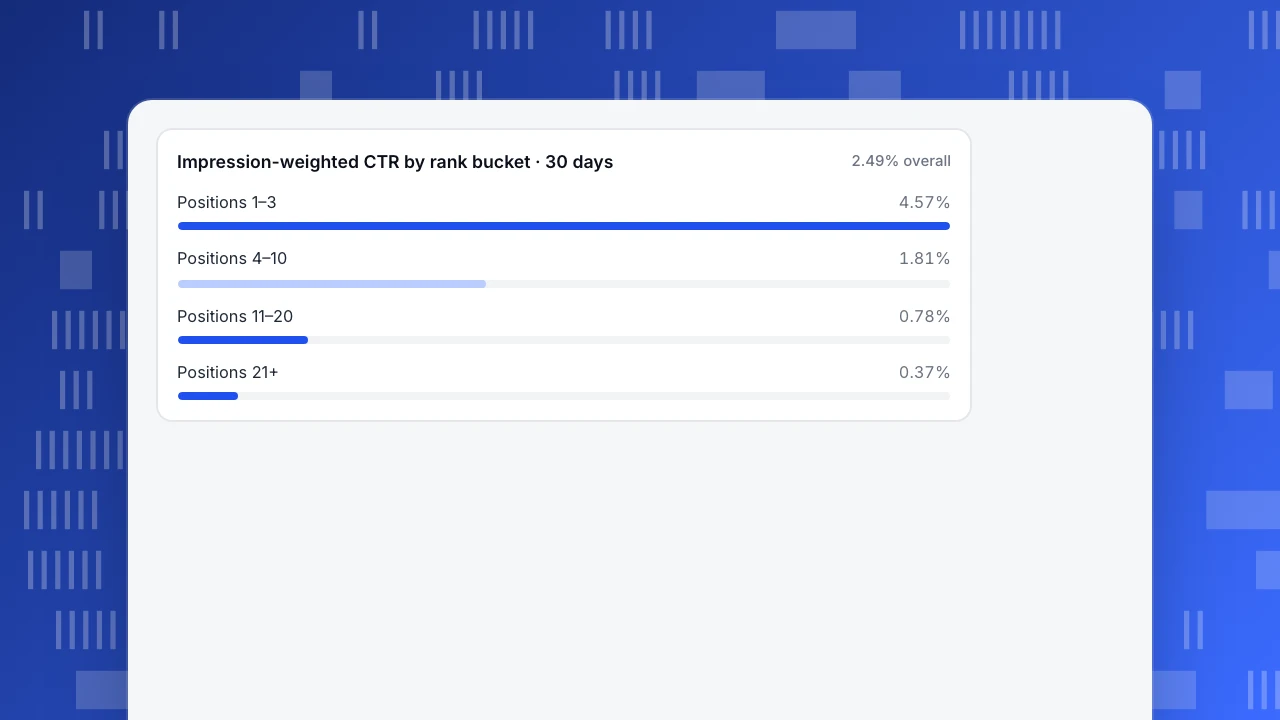
- Weight CTR by impressions: in the sample, 4.57% / 1.81% / 0.78% / 0.37% across buckets 1–3 / 4–10 / 11–20 / 21+ (overall 2.49% vs 1.88% unweighted)
- Fix top-10 pages below the bucket median first: the flagged page at 1.2% vs a 2.0% median is worth +96 clicks per 30 days (+66.7%)
What should a keywords performance report contain?
A keywords performance report is a monthly decision document, not a keyword list. Its job is to answer one question — which page should I change next? — so it reads queries by page and click-through rate (CTR) by rank bucket. A report that only ranks keywords by search volume tells you what people search for; it does not tell you what to do on Monday.
Four blocks make it useful:
- Page rollup. One row per page: impressions, clicks, CTR, average position, rank bucket. This is where you decide what to change.
- Query detail. The queries behind each page, with country, impressions, clicks, CTR and average position. This is where you find the wording for a new title.
- Bucket summary. Queries grouped into rank buckets (1–3, 4–10, 11–20, 21+), with impression-weighted CTR per bucket. This is your benchmark for "a good CTR at this position".
- Next action. One column, one verb per row: keep, rewrite title, expand content, build links. A row without an action is decoration.
The template below shows the query-detail block: nine columns, five sample rows taken from the 20-query example later in this guide.
| Page | Query | Country | Impressions | Clicks | CTR | Avg position | Rank bucket | Next action |
|---|---|---|---|---|---|---|---|---|
| /guides/monstera-yellow-leaves | monstera yellow leaves | US | 9,000 | 420 | 4.67% | 1.8 | 1–3 | Keep title; monitor |
| /guides/pothos-propagation | propagate pothos in water | US | 2,000 | 54 | 2.70% | 5.2 | 4–10 | Watch CTR vs bucket median |
| /guides/snake-plant-watering | how often to water snake plant | US | 5,000 | 60 | 1.20% | 5.5 | 4–10 | Rewrite title + description |
| /guides/snake-plant-watering | snake plant overwatering signs | US | 2,000 | 14 | 0.70% | 12.0 | 11–20 | Add section; target top 10 |
| /guides/fiddle-leaf-fig-dropping-leaves | fiddle leaf fig care indoor | CA | 3,300 | 14 | 0.42% | 21.5 | 21+ | Improve content; build links |
Sample data: a houseplant content site, 30 days. Every number in this guide can be recomputed from the tables.
Two definitions keep the columns honest. CTR is clicks divided by impressions, expressed as a percentage. Average position is the mean position of your topmost result across impressions, so it is impression-weighted: a query seen 5,000 times at position 5 counts more than one seen 50 times at position 2. Google defines both metrics in its Performance report documentation. Rank buckets in this guide use the same weighting: a page's bucket comes from its impression-weighted average position, not from its single highest-ranked query.
| Page | Query | Country | Impressions | Clicks | CTR | Avg position | Rank bucket | Next action |
|---|---|---|---|---|---|---|---|---|
| /guides/monstera-yellow-leaves | monstera yellow leaves | US | 9,000 | 420 | 4.67% | 1.8 | 1–3 | Keep title; monitor |
| /guides/pothos-propagation | propagate pothos in water | US | 2,000 | 54 | 2.70% | 5.2 | 4–10 | Watch CTR vs bucket median |
| /guides/snake-plant-watering | how often to water snake plant | US | 5,000 | 60 | 1.20% | 5.5 | 4–10 | Rewrite title + description |
| /guides/snake-plant-watering | snake plant overwatering signs | US | 2,000 | 14 | 0.70% | 12.0 | 11–20 | Add section; target top 10 |
| /guides/fiddle-leaf-fig-dropping-leaves | fiddle leaf fig care indoor | CA | 3,300 | 14 | 0.42% | 21.5 | 21+ | Improve content; build links |
Sample data: five rows from the 20-query example; CTR = clicks ÷ impressions, positions are impression-weighted averages.
Where do the numbers come from: GSC/Bing or your source report?
If your analytics source report shows only a handful of search terms, the report is not broken — the data was never there. Analytics reads the referrer that the browser sends, and most search engines now strip the query from that referrer for privacy reasons. What survives is a small, biased sample, often labelled "(not provided)" or folded into direct traffic. The full query list lives in the search engines' own tools: Google Search Console (GSC) and Bing Webmaster.
One decision rule covers most teams:
- Need the full query list per page, with clicks and impressions? Connect GSC or Bing Webmaster and build the report from there.
- Only need to know which engines and channels send traffic? The source report is enough; do not chase missing terms.
The three sources differ in coverage, granularity and lag:
| Source | Query coverage | Granularity | Lag |
|---|---|---|---|
| Google Search Console | All queries that earned impressions, minus anonymized queries | Page × query × country × device; clicks, impressions, CTR, position | 1–3 days in TapCub; API marks data fresh vs final |
| Bing Webmaster | Same metrics for Bing traffic | Page, query, country; clicks, impressions, CTR, position | 1–3 days in TapCub |
| Analytics source report | Only queries still present in the referrer | Channel / source / medium, not query-level | Near real-time |
Two GSC limits shape the report. Some queries are anonymized and never appear, so totals in GSC will not match your server logs. And the web export truncates long query lists; the Search Analytics API accepts a rowLimit of up to 25,000 rows per request (default 1,000) and a dataState parameter that distinguishes fresh from final data. Pull via the API when you need the full month, and treat "fresh" numbers as provisional.
Analytics tools can import this data instead of making you switch tabs: Matomo's Search Engine Keywords Performance plugin pulls Google and Bing keyword clicks, impressions, CTR and position into the analytics interface. TapCub does the same through its search-performance report, covered below. For why the terms look thin in the first place, see why search terms look thin; for reading the traffic that survives, see organic traffic.
How do you read it: CTR by rank bucket, impression-weighted?
Reading a keyword ranking report top-to-bottom by volume is how teams end up with a list and no decision. Group the queries by rank bucket instead, and weight CTR by impressions. Here is the full sample: 20 queries, five per bucket, one content site, 30 days.
| Query | Page | Impressions | Clicks | CTR | Avg pos. | Bucket |
|---|---|---|---|---|---|---|
| monstera yellow leaves | /guides/monstera-yellow-leaves | 9,000 | 420 | 4.67% | 1.8 | 1–3 |
| why is my monstera turning yellow | /guides/monstera-yellow-leaves | 7,000 | 322 | 4.60% | 2.4 | 1–3 |
| monstera yellow leaves brown spots | /guides/monstera-yellow-leaves | 5,000 | 196 | 3.92% | 2.9 | 1–3 |
| pothos propagation | /guides/pothos-propagation | 3,000 | 210 | 7.00% | 2.9 | 1–3 |
| snake plant watering | /guides/snake-plant-watering | 2,000 | 40 | 2.00% | 2.5 | 1–3 |
| propagate pothos in water | /guides/pothos-propagation | 2,000 | 54 | 2.70% | 5.2 | 4–10 |
| orchid repotting | /guides/orchid-repotting | 3,500 | 91 | 2.60% | 5.0 | 4–10 |
| when to repot orchid | /guides/orchid-repotting | 2,500 | 55 | 2.20% | 6.2 | 4–10 |
| how often to water snake plant | /guides/snake-plant-watering | 5,000 | 60 | 1.20% | 5.5 | 4–10 |
| snake plant watering schedule | /guides/snake-plant-watering | 3,000 | 30 | 1.00% | 6.0 | 4–10 |
| how long does pothos take to root | /guides/pothos-propagation | 5,000 | 44 | 0.88% | 12.0 | 11–20 |
| pothos propagation mistakes | /guides/pothos-propagation | 4,000 | 28 | 0.70% | 14.1 | 11–20 |
| snake plant overwatering signs | /guides/snake-plant-watering | 2,000 | 14 | 0.70% | 12.0 | 11–20 |
| fiddle leaf fig dropping leaves | /guides/fiddle-leaf-fig-dropping-leaves | 1,800 | 15 | 0.83% | 12.5 | 11–20 |
| fiddle leaf fig brown spots | /guides/fiddle-leaf-fig-dropping-leaves | 1,200 | 8 | 0.67% | 14.5 | 11–20 |
| monstera yellow leaves after repotting | /guides/monstera-yellow-leaves | 800 | 4 | 0.50% | 21.0 | 21+ |
| orchid repotting aftercare | /guides/orchid-repotting | 900 | 4 | 0.44% | 21.8 | 21+ |
| repot orchid with bark | /guides/orchid-repotting | 700 | 2 | 0.29% | 22.4 | 21+ |
| fiddle leaf fig care indoor | /guides/fiddle-leaf-fig-dropping-leaves | 3,300 | 14 | 0.42% | 21.5 | 21+ |
| fiddle leaf fig light requirements | /guides/fiddle-leaf-fig-dropping-leaves | 3,300 | 9 | 0.27% | 22.5 | 21+ |
Sample data. Now sum each bucket and divide clicks by impressions:
| Rank bucket | Queries | Impressions | Clicks | Weighted CTR |
|---|---|---|---|---|
| 1–3 | 5 | 26,000 | 1,188 | 4.57% |
| 4–10 | 5 | 16,000 | 290 | 1.81% |
| 11–20 | 5 | 14,000 | 109 | 0.78% |
| 21+ | 5 | 9,000 | 33 | 0.37% |
| Total | 20 | 65,000 | 1,620 | 2.49% |
The arithmetic, recomputable from the table above: 1,188 ÷ 26,000 = 4.57%; 290 ÷ 16,000 = 1.81%; 109 ÷ 14,000 = 0.78%; 33 ÷ 9,000 = 0.37%. Overall, 1,620 ÷ 65,000 = 2.49%.
Compare that with the unweighted mean of the 20 query CTRs: the displayed CTRs sum to 37.59%, and 37.59 ÷ 20 = 1.88%. The two numbers differ by 0.61 percentage points because the unweighted mean gives a 7.00% query with 3,000 impressions the same vote as a 0.27% query with 3,300 impressions. The weighted figure answers the question you actually have: what CTR does a typical impression earn at this position? Use the weighted number as the benchmark, and the unweighted mean only as a sanity check.
One reading rule follows from the decay: never compare CTR across buckets. A 1.2% CTR at position 6 is weak; a 1.2% CTR at position 22 is strong. The next section turns that into a decision.
Impression-weighted CTR by rank bucket · 30 days
2.49% overallWhich page should you fix first?
The decision rule: a page in the top 10 (bucket 1–3 or 4–10) whose CTR is below the median CTR of pages in the same bucket gets its title and description rewritten first. It already ranks; the snippet is losing clicks that the position has earned. That is the cheapest fix in SEO — no new content, no development work.
Roll the 20 queries up by page (each page row sums all of its queries) and the report looks like this:
| Page | Impressions | Clicks | CTR | Avg pos. | Bucket | Next action |
|---|---|---|---|---|---|---|
| /guides/monstera-yellow-leaves | 21,800 | 942 | 4.32% | 2.9 | 1–3 | Keep; monitor |
| /guides/pothos-propagation | 14,000 | 336 | 2.40% | 9.7 | 4–10 | Above median; no change |
| /guides/orchid-repotting | 7,600 | 152 | 2.00% | 9.0 | 4–10 | At median; watch |
| /guides/snake-plant-watering | 12,000 | 144 | 1.20% | 6.2 | 4–10 | Flagged: rewrite title + description |
| /guides/fiddle-leaf-fig-dropping-leaves | 9,600 | 46 | 0.48% | 19.3 | 11–20 | Striking distance: improve content |
Sample data, same 30 days. Three pages sit in bucket 4–10 with CTRs of 2.40%, 2.00% and 1.20%; the median is 2.00%. The snake-plant page ranks at position 6.2 — comfortably top 10 — yet converts only 1.2% of impressions into clicks, below the 2.00% median. It is flagged.
The expected gain is arithmetic, not a promise. At the bucket median, 12,000 impressions × 2.0% = 240 clicks per 30 days. The page currently earns 144. Closing the gap adds 240 − 144 = +96 clicks per 30 days, a 66.7% lift (96 ÷ 144). The estimate assumes impressions and position hold steady while the snippet improves; treat it as a target to recheck, not a forecast.
Two refinements keep the rule honest. Split branded from non-branded queries before computing medians — branded queries carry high CTR and will mask a weak snippet; the method is in branded vs non-branded keywords. And pick the metrics you will judge the fix by before you change anything, as covered in SEO KPIs.
Pages in bucket 11–20 are the second queue, often called striking distance: they are one content or internal-link push away from the top 10, where the CTR payoff is larger. Work them after the flagged pages, because a title rewrite costs an hour and a content push costs a week.
How do you run this report in TapCub?
The flagged page above — /guides/snake-plant-watering at position 6.2 with a 1.2% CTR — is exactly the kind of finding this report is built to surface. Here is the same workflow in TapCub, continuing that example.
- Connect the data source. In Monitoring › Search performance, connect Google Search Console or Bing Webmaster. Full queries come from those tools; the source report in Web analytics › Sources only shows the referrer terms that survive, which is why it looks thin (why). Baidu has no clicks-and-impressions API, so Baidu traffic stays in the source report.
- Read it by page, query and country. The report shows clicks, impressions, CTR and average position for each page, query and country. Rank buckets are impression-weighted, and the scatter plot draws one dot per page, so a page drifting right (worse position) and down (lower CTR) stands out immediately.
- Act on the flag. On the scatter plot, a page in the top 10 whose CTR is below the median CTR line is coloured as an opportunity (Ranks well, CTR below median). That line is the median across all pages on the chart, a coarser cut than this guide's per-bucket median, so confirm against the 4–10 bucket before you edit: the snake-plant page at 1.2% against the bucket's 2.0% median passes both tests. Rewrite its title and description first: lead with the watering interval the query asks for, not the generic care guide. TapCub measures and flags; it does not rewrite titles or run A/B tests, so the edit happens in your CMS and the verdict comes from the next month's data.
- Recheck monthly. Data lags 1–3 days, so judge the fix after a full month, not a week. If CTR reaches the 2.0% median, the estimate above says roughly +96 clicks per 30 days; if it does not, the snippet is not the problem and the query intent is.
The boundary matters: TapCub tells you which page is losing clicks and what the median says it should earn. It does not write the new title for you, and it does not split traffic between two titles. The report ends in a decision you execute elsewhere.
What does a monthly cadence look like?
A keyword performance report earns its keep on a schedule, not in a one-off audit. Four steps, once a month:
- Pull last month by page × query × bucket. Wait for final data (the API's dataState, or simply the 1–3 day lag plus a few days of margin). Export via the API if the web export truncates your query list.
- Recompute weighted CTR per bucket and the page medians. Compare with last month. Threshold: a bucket's weighted CTR dropping more than 0.3 percentage points month-over-month deserves a look before you touch any title — something changed in the SERP, not just your snippets.
- Pick at most three flagged pages. Top 10, CTR below the bucket median. Rewrite title and description, and annotate the change date so next month's comparison is clean. Three is a deliberate cap: more changes than that and you cannot tell which one worked.
- Recheck after 4–6 weeks. Compare the page's CTR with the bucket median and with the gain estimate. Still below median after two cycles? The problem is intent mismatch, not wording — rewrite the section that answers the query, or target a different query.
Keep this report separate from your always-on SEO dashboard: the dashboard watches trends daily; this report makes one decision a month. And let it feed a single number in your website KPIs — organic clicks per priority page — so the work connects to a goal instead of a spreadsheet. The thesis holds at every step: the report exists to answer which page to change next, by page and by rank bucket, never as a flat keyword list.
FAQ
What should a keyword performance report include?
Four blocks: a page rollup (impressions, clicks, CTR, average position, rank bucket), query detail with country, a bucket summary with impression-weighted CTR, and a next-action column. Nine columns cover it: page, query, country, impressions, clicks, CTR, average position, rank bucket, next action. Without the action column it is a keyword list, not a report.
Why are search terms missing or thin in my analytics report?
Analytics reads the browser's referrer, and most search engines now strip the query from it for privacy. The terms that survive are a small, biased sample. For the full query list with clicks and impressions, connect Google Search Console or Bing Webmaster; the source report is fine for engine-level traffic, not for query-level decisions.
How fresh is the data, and how far back can I go?
In TapCub, search-performance data generally lags 1–3 days; the Search Console API marks data as fresh or final, so treat fresh numbers as provisional. Search Console keeps 16 months of history in the performance report. Pull monthly exports via the API (rowLimit up to 25,000) if you want a longer archive.
What CTR is good for a given position?
There is no universal number — it depends on your queries and SERP features. Use your own bucket medians: in the sample above, weighted CTR runs 4.57% at positions 1–3, 1.81% at 4–10, 0.78% at 11–20 and 0.37% at 21+. Compare a page only with pages in the same bucket, and split branded queries out first.
Which page should I fix first?
The page that already ranks in the top 10 but converts impressions below the bucket median — rewrite its title and description before anything else. In the sample, that is the snake-plant page at position 6.2 with 1.2% CTR against a 2.0% median, worth about +96 clicks per 30 days. The report's whole job is to name that page.
See also: Keyword Grouping: How to Group Keywords by Search Intent.
Sources
- Google Search Console Help. Performance report (Search results) — definitions of clicks, impressions, CTR and average position. Verified 2026-11-15.
- Google Search Console API. Search Analytics: query — dimensions, dataState (fresh vs final), rowLimit up to 25,000. Verified 2026-11-15.
- Matomo. Search Engine Keywords Performance plugin — imports Google/Bing keyword clicks, impressions, CTR and position into analytics. Verified 2026-11-15.
Was this article helpful?
We use your answers to fix and expand this page.
Couldn’t send. Please try again in a minute.
Thanks for the feedback. We’ll use it to improve this page.You’ve already sent feedback on this page. Thanks.

Customer Experience Consultant
Writes about live chat, visitor conversations, and self-service, sharing practical ways to make customer communication clearer and more effective.