Try it on your own data
Every report in this article is in the free plan. One snippet for web and apps, up to 10 sites.
Start freeEcommerce trust signals are evidence placed where shoppers hesitate — price, shipping, checkout and returns — not piled in the homepage footer. This guide ranks the signals that matter, maps each to its exact placement by buying stage, and shows how to find hesitation points with funnel and heatmap data, then measure one fix.
What you will learn
- Place each trust signal at the hesitation it answers — price, shipping, checkout, returns — not in a homepage footer badge wall.
- Payment credibility comes first: secure-payment marks and a clear returns policy at checkout matter more than reviews or social proof.
- Find hesitation points with funnel drops, scroll reach and rage clicks; measure a fix as an observational before/after, not a causal A/B claim.
What are ecommerce trust signals?
Ecommerce trust signals are visible evidence that your store is real, safe and worth buying from: a returns policy, reviews, secure-payment logos, a reachable contact, a human who answers. They are not footer decoration. A signal works only next to the doubt it answers, so a badge that does nothing in the footer can stop an abandonment beside the payment button.
Nielsen Norman Group's research on trustworthiness in web design names four credibility factors, each mapping to something a store can show:
- Design quality — a clean, professional layout; sloppy grammar and broken images read as risk.
- Up-front disclosure — shipping, taxes and returns stated before checkout, not sprung on the last step.
- Comprehensive, correct, current content — real product detail and a policy that matches what you do.
- Connection to the rest of the web — reviews, press, social profiles and a contact that exists outside your domain.
Group the signals you can place into five families, each with one example:
- Policies — a plain-language returns and shipping policy ("Free returns within 30 days").
- Reviews and social proof — verified customer reviews, including negative ones.
- Security and payment — SSL, recognised payment logos, a "secure checkout" line.
- Contact and a human — a real address, phone or email, and live chat staffed by people.
- Transparency — an About Us page, honest stock and delivery times, no fake urgency.
These website trust signals overlap with ecommerce conversion rate optimization; the placement question is which signal, at which moment of doubt.
Which trust signals matter most, and in what order?
Section updated
The order is counterintuitive. In a Judge.me survey of 564 shoppers, asked what makes a store feel trustworthy before they read a single review, secure payment options ranked first, reviews second, and social media presence last at 5.4%. The same survey found missing or fake reviews topped the list of things that immediately destroy trust, and that shoppers value a mix of positive and negative reviews (268 mentions) and written detail (264 mentions) over a high star rating.
Baymard Institute's cart abandonment statistics explain why payment credibility comes first. Across 50 studies the average abandonment rate is 70.22%; once "just browsing" is removed, 19% abandoned because they did not trust the site with their credit card information, and 13% because the returns policy was not satisfactory. (The formula and improvement list are in cart abandonment rate; here the point is which doubts signals answer.)
On the store side, Welo Badge, a business-verification vendor, reports in its 2026 Trust Gap study that 39% of the 200+ US and Canada consumer brands it reviewed showed no returns information or returns link on the product page, and 38% gave no concrete delivery date. The method is the vendor's own (public shopping path reviewed without placing an order; brand list and dataset not published), so read it as an indicative sample, not an industry benchmark. It still points the same way as the shopper data above: returns and delivery are real doubts, and many stores leave them unanswered where the shopper is looking.
The decision rule: if payment credibility fails, reviews never get read. Fix security and payment signals at checkout before investing in more social proof. A wall of five-star reviews cannot rescue a payment form that looks unsafe.
Where should each trust signal go?
Place each signal at the hesitation it answers, not in a footer badge wall. The placement cards below map five buying stages to the shopper's doubt, the signal that answers it, and the exact spot to put it.
Read the table as a checklist: for each stage ask "what is the shopper afraid of here, and can they see the answer without scrolling away?" The checkout row is where most trust fixes earn their keep, because card details and final cost collide there. Post-purchase support turns a buyer into a repeat buyer.
Two rules hold across every row. The signal must be visible at the moment of doubt — above the fold on checkout, beside the price on the product page — not one click away. And one clear signal beats a cluster: a single "secure checkout" line by the payment button outperforms ten badges nobody reads.
| Buying stage | Hesitation / question | Trust signal to place | Where exactly |
|---|---|---|---|
| Homepage / first visit | Is this store real? | Contact info, About Us, professional design, secure-payment logos | Header/footer contact + a visible 'secure checkout' line, not a badge wall |
| Product page | Will this product work for me? Can I return it? | Reviews (mixed positive/negative), written detail, clear returns policy | Beside the price/add-to-cart, returns link next to the buy button |
| Cart | What will I actually pay? | Shipping cost and total up-front, free-returns line | In the cart summary before the checkout button |
| Checkout / payment | Is my card safe? What if I change my mind? | Security/SSL badge, payment logos, returns guarantee, live-chat invite | Directly beside the payment button (the hesitation point), above the fold |
| Post-purchase | Did it work? Where is my order? | Order confirmation, tracking, reachable support | Confirmation email + a tracked order page |
Sample placement cards: each signal sits where the hesitation happens, not in the homepage footer. Measure each placement with the funnel + heatmap method below.
How do you find the hesitation points on your store?
Three behaviour signals show where shoppers hesitate. Build a checkout funnel and read them in order:
- Where the funnel leaks. If the biggest drop is checkout → payment, the doubt is cost or card safety, not the product. In the sample store below, 10,000 entered checkout but only 6,200 started payment — 3,800 lost at that one step.
- How far people scroll. A scroll heatmap shows whether the trust section is seen at all. If fewer than 40% of checkout visitors scroll to your badges and returns line, move them above the fold; a signal nobody reaches answers nothing.
- Where people rage-click. Repeated clicks on a shipping cost, a returns link or a dead coupon field mark a spot where the shopper expects an answer and gets none.
The rule: a hesitation point is a step with a large funnel drop, low scroll reach to the signal, and rage clicks nearby. Fix that intersection first. In the sample store, only 32% scrolled to the trust section below the payment button, and shipping/returns logged 410 rage clicks in 30 days — three signals pointing at one place.
What does one trust fix look like, measured?
Sample data, observational before/after — not an A/B test. One store moved security badges, a free-returns line and a live-chat invite beside the payment button and removed a fake countdown. Traffic mix was similar across both months.
Month A (before):
- 10,000 entered checkout → 6,200 started payment (62%) → 2,500 completed.
- Checkout completion: 2,500 ÷ 10,000 = 25.0%. Biggest drop: checkout → payment (3,800 lost).
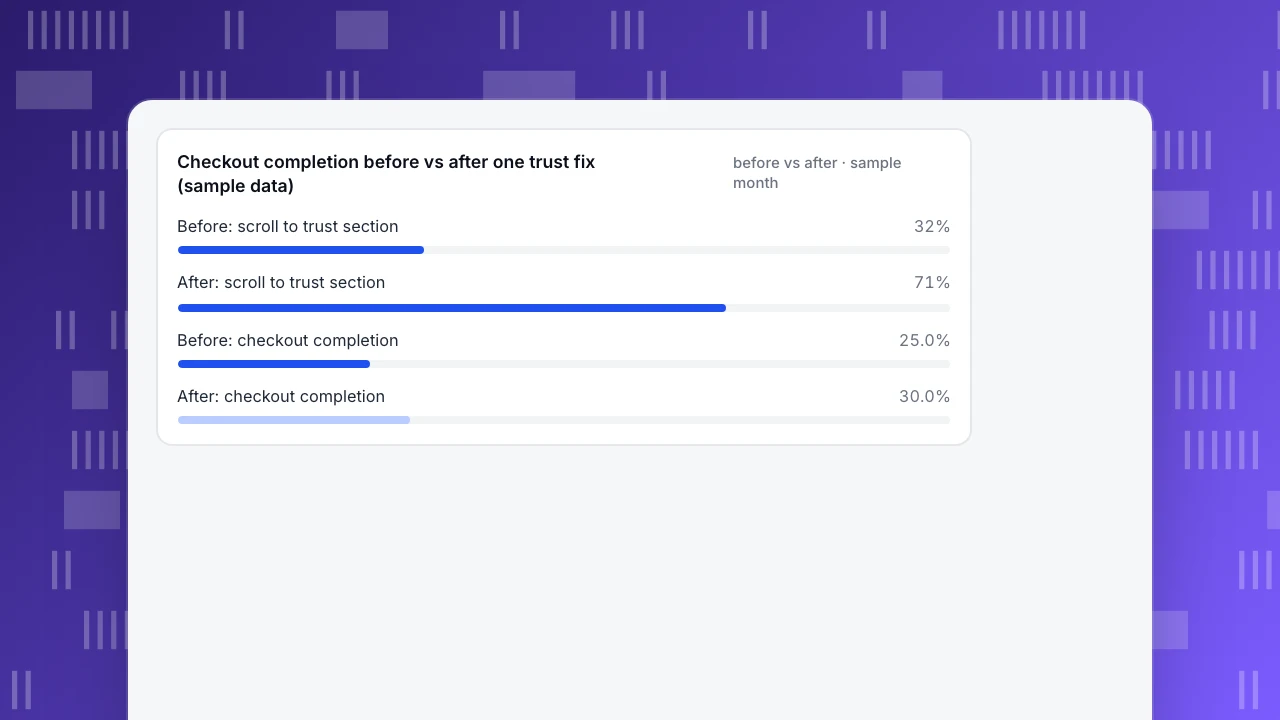
- Scroll-to-trust: 32%. Rage clicks at shipping/returns: 410 in 30 days.
Month B (after):
- 10,400 entered checkout → 7,000 started payment (7,000 ÷ 10,400 = 67.3%) → 3,120 completed.
- Checkout completion: 3,120 ÷ 10,400 = 30.0%. That is +5.0 percentage points, or 30.0 ÷ 25.0 − 1 = +20% relative.
- Scroll-to-trust: 32% → 71% (+39 pp). Rage clicks: 410 → 150, a fall of (410 − 150) ÷ 410 = −63.4%.
Chat attribution slice (Month B): 800 visitors chatted and 320 bought: 320 ÷ 800 = 40.0%. Of 9,600 who did not chat, 2,800 bought: 2,800 ÷ 9,600 = 29.2%. Totals reconcile: 800 + 9,600 = 10,400 visitors and 320 + 2,800 = 3,120 buyers, matching 3,120 ÷ 10,400 = 30.0% overall. Relative lift = (320/800) ÷ (2800/9600) − 1 ≈ +37.1%.
Read the gap with care. People who chat are often further along or get an answer on the spot, so this is self-selection, not proof chat caused the lift; seasonality and traffic mix can explain part of the change too. It is observational — watch the ecommerce conversion rate trend, not a causal claim. The signal worked because it moved to the hesitation point, and the data located that point.
Checkout completion before vs after one trust fix (sample data)
before vs after · sample monthWhich trust signals should you never fake?
Some "trust signals" destroy trust the moment they are detected, and a few are illegal:
| Temptation | Why it backfires | Do instead |
|---|---|---|
| Fake or bought reviews | Missing or fake reviews top the distrust list (Judge.me); the FTC rule below bans them | Show real reviews, including negative ones, with written detail |
| Fake countdowns and urgency | If the offer is not genuinely time-limited, the countdown is a lie shoppers learn to spot | Use real deadlines only, or none; state honest delivery times |
| A wall of unverifiable badges | Badges nobody recognises add noise, not credibility | One or two recognisable payment/security marks at the payment button |
The FTC's Trade Regulation Rule on the Use of Consumer Reviews and Testimonials, 16 CFR Part 465, effective 2024-10-21, prohibits fake or bought reviews and testimonials, insider reviews without disclosure, company-controlled "independent" review sites, review suppression, and buying fake social-media influence metrics.
The decision rule: if a signal asserts something untrue — a review you did not earn, a deadline that does not exist — it is a liability, not a trust signal. Honesty is the constraint every placement above must satisfy.
How to verify trust signals with data in TapCub
The checkout fix above is one you can locate and verify in TapCub, because analytics and live chat run on one script and one visitor ID. The scenario:
- Find the leaking step. Build a cart → checkout → payment → purchase funnel in All-platform analytics › Behavior › Behavior analysis. In Month A the payment step leaks most. Bots and AI crawlers are counted separately, so the denominator is real people.
- See the hesitation. In All-platform analytics › Behavior › Heatmaps, read click, rage, scroll and element maps on checkout: rage clicks at shipping, only 32% scrolling to the trust zone. To watch one session, open All-platform analytics › Behavior › Session replay (off by default; enable deliberately). A slow or broken checkout also kills trust: check Core Web Vitals in Monitoring › Performance and payment-step failures in Monitoring › Errors.
- Place the signal and answer live. Move the badges, returns line and chat invite beside the payment button, then add a rule in Live chat › Chat settings › Proactive invites: path contains /checkout, dwell 30 seconds (anything from 3 to 600), with an invite line that answers the doubt — "Questions about shipping or returns? Ask here before you pay." The rule list records impressions, open rate and reply rate, so you can see whether shoppers take it up.
- Catch the question. In Live chat › Inbox, the side panel shows the visitor's source, current page and last two days of browsing, with one click to the analytics profile, so an agent answers shipping, returns or card-safety questions in context. No pre-chat form: ask for an email in chat or use an offline message. For the queue behind those answers, see ecommerce help desk.
- Measure the comparison. Set up a purchase goal in Web analytics › Goals first; with no goal, the comparison stays at 0. Live chat › Reports › Conversion attribution then compares, day by day, visitors who chatted and reached the goal with those who browsed without chatting (40.0% vs 29.2% over Month B, about +37.1% relative) and lists the pages where chats started — checkout should top that list after the invite goes live. A chat counts toward a purchase only on the same calendar day, and fewer than 30 chatters is flagged as too small. Track the before/after funnel and heatmap (25.0% → 30.0%) as observational, not causal.
Boundaries: TapCub does no A/B testing or traffic splitting, so this is observational, not a controlled experiment. It has no reviews or testimonials feature — it measures whether a review zone is read and clicked, but does not collect or host reviews. Session replay stays off until enabled, and collection follows the consent settings in Configuration › Privacy center. See live chat for ecommerce for the chat-side playbook.
FAQ
How do I build trust in my online store?
Clear the payment-credibility check first, then place signals by buying stage. Shoppers judge safety before reading reviews, so secure-payment marks and a clear returns policy at checkout matter more than a homepage badge wall. Use your funnel and heatmaps to find hesitation points, put the answering signal there, and measure an observational before/after.
Do trust badges increase conversion?
Only at a hesitation point. A footer badge nobody scrolls to answers no doubt; the same badge beside the payment button can reduce abandonment. In the sample store, moving badges, returns and a chat invite to the payment button coincided with completion rising from 25.0% to 30.0% — observational, not proof of cause. Measure your own before/after.
Where should I put trust badges on checkout?
Directly beside the payment button, above the fold, where card details and final cost create doubt. Pair a recognisable security or payment mark with a one-line returns guarantee and a live-chat invite — one or two marks, not a cluster. If a scroll heatmap shows fewer than 40% reach your badges, move them up.
What are examples of trust signals?
Examples: verified customer reviews (including negative ones), security and payment logos, a plain-language returns and shipping policy, a real contact address and phone, an About Us page, and live chat staffed by people. Each answers a doubt: reviews "will it work for me", payment marks "is my card safe", policies "what if I change my mind".
Does live chat build trust?
It can, by answering a blocking question at the moment of doubt — shipping, returns or payment safety on checkout. In the sample month, visitors who chatted converted at 40.0% versus 29.2% for those who did not. That is observational: chatters are often further along, so the gap overstates chat's cause. Compare chatted vs non-chatted conversion, not volume.
Can I use fake reviews or countdowns to build trust?
No. Missing or fake reviews top the list of things that destroy trust, and the FTC's 16 CFR Part 465 rule (effective 2024-10-21) bans fake or bought reviews and testimonials. A countdown for an offer that is not genuinely time-limited is a lie shoppers learn to spot. Use real reviews and deadlines only; a fabricated signal is a liability.
See also: About Us Page Examples: What to Write, With Five Business Types.
See also: Return Policy Template: Copy-Paste Return and Shipping Policies for Ecommerce.
Sources
Section updated
- Harley, A. (2016). Trustworthiness in Web Design: 4 Credibility Factors. Nielsen Norman Group — design quality, up-front disclosure, comprehensive/current content, connection to the rest of the web. Verified 2026-11-15.
- Baymard Institute. Cart Abandonment Rate: 50 Statistics (2026) — 70.22% average abandonment; 19% credit-card distrust and 13% returns-policy dissatisfaction after removing just-browsing. Verified 2026-11-15.
- Vuong, L. (2026). What shoppers told us about trusting an online store. Judge.me — 564-shopper survey; secure payment first, reviews second, social media 5.4%. Verified 2026-11-15.
- Taddei, D. (2026). 2026 Trust Gap Report. Welo Badge — vendor-run review of 200+ US and Canada consumer brands; 39% no returns information or link on the product page, 38% no concrete delivery date. Self-described method, brand list and dataset not published; Welo sells verification services. Verified 2026-11-20.
- Federal Register. Trade Regulation Rule on the Use of Consumer Reviews and Testimonials, 16 CFR Part 465 — FTC final rule, effective 2024-10-21. Verified 2026-11-15.
Update history1
- UpdateAdded a vendor study on how many stores leave returns and delivery questions unanswered, clearly labelled as an indicative sample.
- First published
Was this article helpful?
We use your answers to fix and expand this page.
Couldn’t send. Please try again in a minute.
Thanks for the feedback. We’ll use it to improve this page.You’ve already sent feedback on this page. Thanks.

Data Engineer
Writes about event design, data quality, and collection workflows, with verifiable implementation methods for reliable analytics.