Try it on your own data
Every report in this article is in the free plan. One snippet for web and apps, up to 10 sites.
Start freeA SaaS customer success strategy finds problems before customers do: usage-based health scores flag at-risk accounts early, and tiered service puts human effort only where it is needed. This guide walks through the four lifecycle stages, a recomputable health-score example, ARR-by-health tiering rules, trigger-action-owner playbooks, and the GRR/NRR math that proves the strategy works.
What you will learn
- Find problems before customers do: score accounts from usage breadth, depth and recency, and alert on thresholds — not on complaints.
- Tier by ARR × health with written if-then rules and a capacity budget: 2 CSMs × 5 accounts = 10 high-touch slots.
- Judge the strategy on cohort GRR and NRR together: NRR 102% with GRR 90% means expansion is hiding churn.
What is a SaaS customer success strategy?
A SaaS customer success strategy is a plan for making sure customers get the value they were promised — before they have to ask for it. Hochstein et al. (Journal of Service Research, 2020) define customer success management as proactively ensuring customers realize the product's promised value, rather than reacting to problems, and argue this reduces churn. The strategy is the operating system around that idea: stages, signals, risk scores, who gets human attention, and the numbers that prove it worked.
The dividing line with support is timing:
| Customer support | Customer success | |
|---|---|---|
| Trigger | The customer reports a problem | Usage data shows risk before any complaint |
| Goal | Resolve the ticket | Make sure the promised value is realized |
| Measured by | Resolution rate, first response time | GRR, NRR, adoption, renewal rate |
Support still matters, but a team that only answers tickets learns about churn when the cancellation email arrives. This guide builds the system that finds the problem first.
What happens in each stage: onboarding, adoption, expansion, renewal?
Post-sale life splits into four stages, each with its own goal, early-warning signal and metric (table after this section). Every row follows one rule: the signal must move before the customer complains.
- Onboarding is a race to first value: define activation (say, the first completed core workflow), set a 14-day deadline, and warn at day 7 while there is time to help.
- Adoption is where value becomes habit: watch weekly activity on the core workflow — a slide appears in usage weeks before any cancellation notice.
- Expansion is earned, not pitched: healthy accounts near seat or usage limits are worth a conversation.
- Renewal starts months before the contract date: health below 60 inside a 90-day window turns a routine renewal into a save attempt.
Accounts move through the stages unevenly; SaaS customer journey covers the handoffs. You need one owner and one warning signal per stage.
| Stage | Early-warning signal | Metric to watch |
|---|---|---|
| Onboarding | No activation by day 7 (target: day 14) | Activation rate within 14 days; time to value |
| Adoption | Core-workflow weekly actives sliding; usage halved over 30 days | Weekly active accounts; core-feature adoption |
| Expansion | Nearing seat or usage limits while health ≥ 60 | Seat utilization; expansion-ready accounts |
| Renewal | Health < 60 with renewal ≤ 90 days; champion departed | Renewal rate; GRR and NRR |
Sample thresholds — tune them to your product and contract terms. The signal column is the point: each fires before the customer complains.
How do you design a health score from usage data?
A health score turns "this account feels quiet" into an actionable number. Three usage inputs cover most of it:
- Breadth — what share of the account's members were active in the last 30 days. One power user masking nine absent colleagues is a classic churn setup.
- Depth — on what share of the last 30 days was the account active at all. Habit shows up here.
- Recency — was anyone seen in the last 7 days (full points), or only within 30 days (half)?
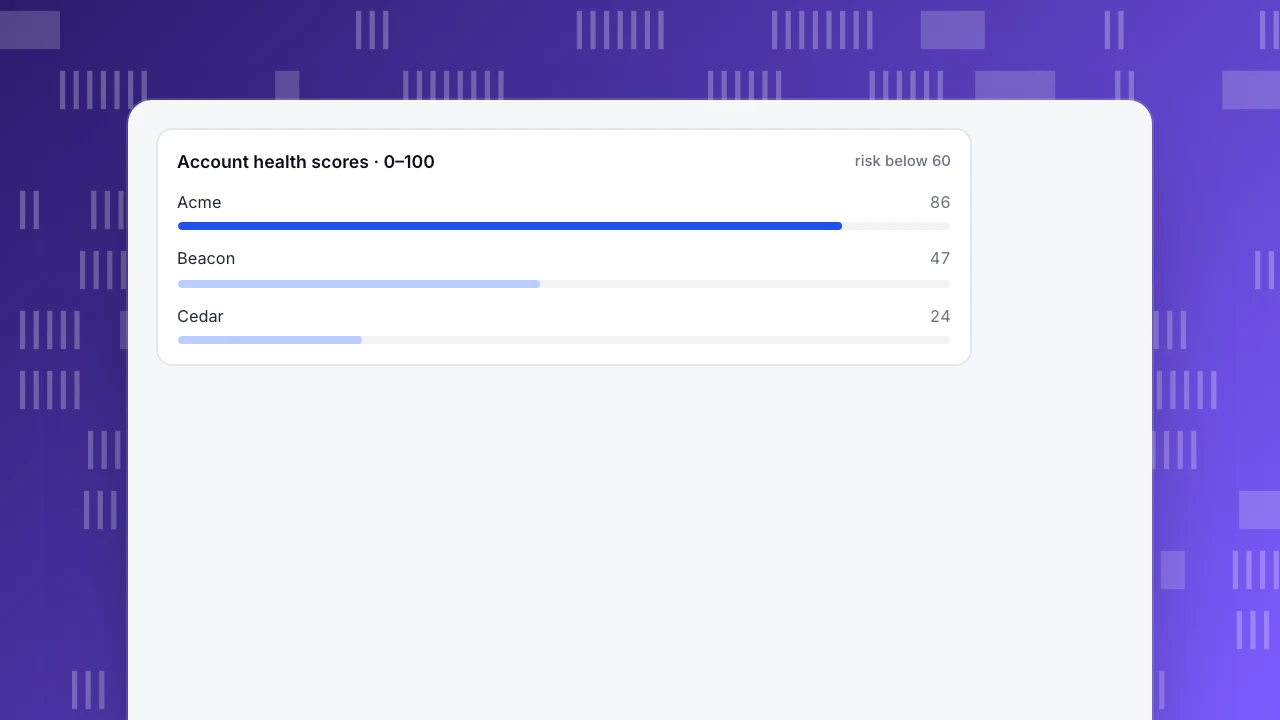
TapCub's account health score combines them on a 0–100 scale: active-member share × 40 + active-days share × 30 + 30 points for seen-in-last-7-days (15 if seen only within 30 days). Sample data — three accounts, recomputed from raw inputs:
- Acme: 8 of 10 members active, active on 24 of 30 days, seen this week → 8/10 × 40 + 24/30 × 30 + 30 = 32 + 24 + 30 = 86.
- Beacon: 4 of 8 members active, 12 of 30 days, last seen 10 days ago → 4/8 × 40 + 12/30 × 30 + 15 = 20 + 12 + 15 = 47.
- Cedar: 1 of 5 members active, 1 of 30 days, last seen 10 days ago → 1/5 × 40 + 1/30 × 30 + 15 = 8 + 1 + 15 = 24.
The chart below shows the scores against thresholds: 80+ healthy, 60–79 watch, below 60 at risk. Acme needs nothing; Beacon and Cedar enter the play queue — before either has complained. Design details: customer health score. Every input is usage data you already collect, and every score can be recomputed by hand.
Account health scores · 0–100
risk below 60How do you tier service with limited CSM capacity?
Health decides urgency; ARR decides how much human time an account gets. Write if-then rules so nobody renegotiates them in a panic:
- If ARR ≥ $25,000 and (health < 60 or renewal within 90 days) → high-touch: a named CSM owns the account.
- If ARR < $25,000 and health < 60 → low-touch: pooled CSMs intervene by trigger, not by calendar.
- If health ≥ 60 → self-serve: docs, knowledge base and in-app guidance, plus an expansion prompt when the account nears its seat limit.
Sample data: a 20-account book scores 6 / 5 / 5 / 3 / 1 across the bands 80–100, 60–79, 40–59, 20–39 and 0–19. Nine accounts (45%) sit below 60, and four of those renew within 90 days — the renewal-priority list. Six accounts match the high-touch rule: the four renewal-priority accounts (all above $25,000 ARR) plus two more $25,000-plus accounts below 60. The other three at-risk accounts go to the pooled queue; the eleven healthy accounts stay self-serve.
Capacity math: two CSMs × five high-touch accounts each = ten slots. Six filled leaves four for the next wave, and the rule — not the loudest customer — decides who gets them. If the list exceeds ten, move the ARR threshold or hire a CSM; giving every account the same attention does not scale.
What should a playbook specify: trigger, action, owner?
A score without a play is just a dashboard. Each play needs a threshold trigger, one action, and a named owner with a deadline:
| Trigger | Action | Owner |
|---|---|---|
| Not activated by day 7 | Resend the onboarding checklist; book a 20-minute setup call | Onboarding specialist, same day |
| Core-workflow usage halved over 30 days | Re-onboarding session naming that feature; check for a broken integration or a departed champion | CSM, within 5 business days |
| Health < 60 and renewal ≤ 90 days | Save plan: executive sponsor call, success review, commercial options | CSM, outreach within 5 business days |
Sample data, one quarter of running the third play: last quarter, 8 at-risk accounts came up for renewal and 3 renewed (3/8 = 37.5%); this quarter, 8 of 10 renewed (8/10 = 80%) — a 42.5-point difference. It is observational, with no control group — accounts, market and product all changed too — so keep measuring; this is not proof of causation.
A field experiment supports the direction: Retana, Forman and Wu (M&SOM, 2016) gave 366 of 2,673 new customers of a public cloud provider proactive guidance on basic features. First-week churn halved, first-week support questions fell 19.55%, and cumulative usage eight months after signup was 46.57% higher than the control group. More worked examples: customer retention examples.
How do GRR and NRR show whether the strategy works?
Playbooks are judged by cohort math, not activity counts: take the accounts paying at the start of a period and follow only their revenue.
- GRR = (starting MRR − churn − contraction) ÷ starting MRR
- NRR = (starting MRR − churn − contraction + expansion) ÷ starting MRR
New logos are excluded from both; GRR excludes expansion, so it can never exceed starting revenue.
Sample data: a cohort starts at $50,000 MRR. Over the year, $4,000 churns, $1,000 contracts, $6,000 expands:
- GRR = (50,000 − 4,000 − 1,000) ÷ 50,000 = 45,000 ÷ 50,000 = 90%
- NRR = (50,000 − 4,000 − 1,000 + 6,000) ÷ 50,000 = 51,000 ÷ 50,000 = 102%
For context, SaaS Capital's 2025 survey of private SaaS companies (all above $1M ARR) puts median NRR at 102% for the $25,000–$50,000 ACV band and median growth at 24% across the full sample.
Read the pair, not either number alone. NRR 102% looks like a win, but GRR 90% says $5,000 of the starting base leaked and expansion papered over it. That is exactly the failure mode this guide is about: problems the customer found before you did. Definitions and edge cases are in net revenue retention and gross revenue retention.
How do you run this playbook in TapCub?
The 20-account book above runs in TapCub on one script: analytics and live chat share the same visitor ID, so the data feeding the score also sits in the chat window.
- Group people into accounts. After login, call
tapcub.group('company', 'acme', {...}); identified members roll up under the account, and anonymous visitors never join (setup: analyze accounts with groups). All-platform analytics › Users › Accounts shows account counts, 30-day active accounts, members and the 0–100 health score, sortable by Health — the same rule as above: share of members active in 30 days × 40, share of the last 30 days with activity on the account × 30, and 30 points for last seen within 7 days (15 within 30 days). Acme 86, Beacon 47, Cedar 24. An account with no last-seen time shows no score rather than an invented one. - Find champions going quiet. In All-platform analytics › Users › Segments & tags, a rule-based segment ("did your core event in the previous 30 days, did not do it in the last 14") or an RFM segment built on your core event lists the people whose activity is sliding; RFM buckets such as champions and cannot lose are recomputed daily and their moves are stored. Segments carry into retention analyses as cohorts — a self-updating early-warning list.
- Watch the trend, don't refresh it. In All-platform analytics › Behavior › Metrics & SQL, save a metric with the account identity — for example, distinct accounts that did your core event — then pick it as the saved metric in All-platform analytics › Operations › Monitors with a weekly check. Dry-run computes without sending and shows how often the past 30 days would have fired; monitors only notify, never act. The monitor watches the book as a whole; the per-account health score is read on the Accounts page, so put "sort by Health, review everything below 60" into the weekly CSM routine.
- Reach out with context. When a member of Beacon or Cedar opens a chat,
tapcub.loginmeans the agent knows who they are, and the Live chat › Inbox side panel shows the source, the last two days of browsing and past conversations, so the agent can see the feature they were stuck on and book the re-onboarding session there. Live chat › Chat settings › Proactive invites can trigger on the help pages of the feature whose usage halved (page + dwell seconds). The session itself, and the renewal conversation, happen outside TapCub. - Verify the save. All-platform analytics › Behavior › Behavior analysis shows retention for the intervened cohort and lifecycle counts (New / Returning / Resurrecting / Dormant), and the account health scores on the Accounts page should climb back above 60. If the active-accounts metric drops, ask All-platform analytics › Operations › AI Assistant why, and it decomposes the change by channel, source domain, country, device and landing page.
Boundaries: TapCub is not a CRM — ARR, renewal dates and renewal outcomes (the 3/8 → 8/10 above) live in your CRM or billing system, so the ARR × health tiering is done there or in a spreadsheet. It does no email marketing, A/B testing or NPS/CES surveys; it measures, and your team acts.
FAQ
What is a customer success strategy in SaaS?
A plan for ensuring customers realize the value your product promised, proactively rather than after complaints: manage four stages — onboarding, adoption, expansion, renewal — with usage-based health scores, if-then service tiers, trigger-action-owner playbooks, and GRR/NRR to judge results. The core idea: find problems in the usage data before the customer finds them.
What is the difference between customer success and customer support?
Support reacts: the customer reports a problem and the team resolves it, measured by response and resolution times. Customer success acts first: usage signals — falling activity, quiet champions, a low health score near renewal — trigger outreach before a ticket exists, measured by retention and adoption. Support conversations also feed success signals.
What metrics should customer success teams track?
Track activation rate and time to value in onboarding, weekly core-workflow usage in adoption, and seat utilization for expansion. For outcomes, use gross revenue retention (GRR) and net revenue retention (NRR) on starting-revenue cohorts, plus renewal rate. GRR exposes leaks that expansion hides; NRR alone can look healthy while the base erodes.
How do you spot at-risk customers before they complain?
Score accounts from usage, not sentiment: breadth (share of members active in 30 days), depth (share of days active) and recency (seen in the last 7 days). Set thresholds — below 60 out of 100 here — and let monitors alert you weekly. A quiet champion or halved usage is visible in the data weeks before a cancellation email.
What is the difference between high-touch and low-touch customer success?
High-touch gives a named CSM to accounts combining high ARR with risk or a near-term renewal. Low-touch pools smaller at-risk accounts and intervenes by trigger, not a fixed calendar; healthy accounts get self-serve resources. Written if-then rules and CSM capacity decide the tier, so attention goes where the revenue risk is.
When should you hire your first CSM?
When retention work no longer fits between other jobs: at-risk accounts exceed what founders or support can reach before renewal, or the high-touch list outgrows capacity — in our example, two CSMs × five accounts = ten slots. Hire against a defined book of accounts and playbooks, not a vague "own the customer" mandate.
See also: Customer Success KPIs: Which Ones Warn You Before a Customer Leaves.
See also: B2B Loyalty Programs: Types, Metrics and Why Renewal Beats Points.
Sources
- Hochstein, B., Rangarajan, D., Mehta, N., & Kocher, D. (2020). An Industry/Academic Perspective on Customer Success Management. Journal of Service Research, 23(1), 3–7. Paywalled; abstract verified via search index, 2026-11-15.
- Retana, G. F., Forman, C., & Wu, D. J. (2016). Proactive Customer Education, Customer Retention, and Demand for Technology Support: Evidence from a Field Experiment. Manufacturing & Service Operations Management, 18(1), 34–50. Paywalled; abstract verified via search index, 2026-11-15.
- SaaS Capital (2025). What Is a Good Retention Rate for a Private SaaS Company? — cohort GRR/NRR formulas; median NRR 102% ($25k–$50k ACV), median growth 24% (ARR > $1M sample). Fetched directly; verified 2026-11-15.
Was this article helpful?
We use your answers to fix and expand this page.
Couldn’t send. Please try again in a minute.
Thanks for the feedback. We’ll use it to improve this page.You’ve already sent feedback on this page. Thanks.

Product Adoption Consultant
Explores customer onboarding, live conversations, and self-service, turning common usage questions into practical guidance and improvements.