Try it on your own data
Every report in this article is in the free plan. One snippet for web and apps, up to 10 sites.
Start freeCustomer retention examples work when they aim at a specific reason people leave. This guide groups twelve copyable tactics by five churn reasons — never reached value, friction, forgot, pulled away, payment — each with a tactic, when to use it and a metric, plus a recomputable win-back before/after. Diagnose your own curve first, then pick the card.
What you will learn
- Group examples by why people leave — never reached value, friction, forgot, pulled away, payment — and pick the card that matches the signal in your own cohort data
- Each card carries a tactic, a when-to-use rule and a metric; the sample win-back lifted 30-day returns from 10.0% to 24.0% (+14.0 pp, 2.4x) on the activated-once dormant segment
- A before/after gap is observational, not causal: keep the segment definition and window identical, check channel mix, and confirm with a third cohort
Where are you actually losing customers?
Customer retention is the share of a starting group of customers who are still active after a given period; the definition and the cohort mechanics are in retention. Most lists of retention examples are organised by brand, which tells you what a famous company did but not whether it fits your leak. These examples are grouped by the reason people leave, so the first job is to name your reason from your own data, then pick the card that matches it.
Sample data: a January cohort of 1,000 new users, tracked for six months.
| Month after signup | Users who returned | Retention |
|---|---|---|
| M1 | 400 | 40.0% |
| M2 | 280 | 28.0% |
| M3 | 220 | 22.0% |
| M4 | 190 | 19.0% |
| M5 | 170 | 17.0% |
| M6 | 160 | 16.0% |
Each rate is returns divided by the starting 1,000: 400 ÷ 1,000 = 40.0% at M1, down to 160 ÷ 1,000 = 16.0% at M6. The first month is where most of the loss happens: 1,000 − 400 = 600 users gone. Split those 600 by behaviour and you get two different problems: 360 never fired the activation event (they never reached value), and 240 activated once and then went quiet. Same curve, two groups, two sets of examples.
The shape of the curve is a diagnostic, not just a score. A steep drop from M1 to M2 that flattens afterwards usually means the product works for the people who stay, and the leak is at the start — onboarding and first value. A curve that keeps sliding month after month usually means ongoing value is missing, so look at the forgot and pulled-away groups. Read the shape before you read the rate: a 16.0% six-month number can hide a first-month cliff or a slow bleed, and the two call for different cards.
Define the activation event before you split anything: it is the single action that best predicts a second session — "sent first message" for a chat product, "created first report" for analytics. Without that event you cannot tell the 360 who never reached value from the 240 who reached it once.
One rule before the cards: if most of your first-month losses never fired the activation event, start with the never-reached-value group. A loyalty program aimed at those 360 will not move the curve. The table after this section maps five churn reasons to the signal that reveals each one and the cards that address it. Metric definitions live in retention metrics; churn prevention as a discipline is covered in churn prevention. This page is about examples you can copy.
| Churn reason | Signal in your data | Cards to start with |
|---|---|---|
| Never reached value | Most first-month losses never fired the activation event | 1–3 |
| Hit friction | One funnel step completes far below its neighbours; support contacts cluster there | 4–5 |
| Forgot you exist | Long gaps between sessions; the dormant segment grows while churn stays flat | 6–8 |
| Pulled away | Cancels cite a competitor; usage drops before the cancel | 9–10 |
| Stuck at payment | Failed charges precede a large share of cancels | 11–12 |
Signals are illustrative; confirm each one in your own cohort and funnel data before choosing a card.
Examples for customers who never reached value
These users signed up and left before the product did anything for them. In the sample cohort they are the 360 who never activated. If your activation event completion rate is low, fix this group before spending on loyalty or win-back: no reminder can rescue a user who never saw the point.
1. Value-first onboarding
Tactic. Rebuild the first session around one outcome the user came for. Start from templates or sample content so the first useful result happens in minutes, not after a setup tour. Notion's template-led onboarding is the pattern Churnkey's roundup describes. Pick the single action that most often precedes a second session, and make that action the whole first run.
When to use. Most first-month losses never fired your activation event.
Metric. Activation rate (share of new users who fire the activation event within 7 days) and time-to-first-value.
2. Show users their own results
Tactic. Surface the user's own outcome inside the product and in a periodic summary: progress, time saved, results created. HubSpot's retention guide lists making the customer's ROI visible as a core strategy. The summary should name something the user did, not a generic feature pitch — "you cleared 14 tasks this week" beats "try our new dashboard".
When to use. Users activate once but do not return; they got value but never saw it accumulate.
Metric. Return rate of users who saw a results summary versus those who did not (observational), and repeat activation.
3. Extend the trial or add a free tier
Tactic. Lengthen the trial or keep a free tier so the user reaches value before paying. Spotify's trial offers and Slack's freemium entry are the reported patterns in Churnkey's and Joy's roundups. Measure your median time-to-value first; if it is longer than the trial, the trial is ending before the product has had a chance to prove itself.
When to use. Time-to-value is longer than your trial, or the paywall hits before activation.
Metric. Activation-within-trial rate and trial-to-paid conversion.
Examples for customers who hit friction
These users reached value once, then got stuck on a step and gave up. The signal is a funnel step that completes far below its neighbours, or support contacts clustering on one page. Fix the step before you add incentives; a discount does not unblock a broken form.
4. Remove the step where people stall
Tactic. Find the lowest-completion step in the funnel and remove or simplify it. Mint Mobile's checkout simplification is the example HubSpot's guide reports. Change one step at a time and re-read the funnel, so you can tell which edit moved the number rather than guessing after a redesign.
When to use. One step's completion rate is clearly lower than the steps before and after it.
Metric. Step completion rate before and after the change, and overall funnel conversion.
5. Offer a human at the stuck moment
Tactic. Trigger help on the page where people stall, instead of waiting for a ticket. Chewy's personalized support is the pattern Joy's roundup highlights. The invite should name the page and offer one specific thing — "stuck on this step? I can walk you through it" — rather than a generic "how can I help" fired everywhere.
When to use. Support contacts cluster on one page or step, and the same question repeats.
Metric. Resolution rate on those conversations, and step completion after help.
Examples for customers who forgot you exist
These users got value and simply stopped thinking about you. Usage is episodic, and the dormant segment grows while churn stays flat. Timing rule: send the reminder after the user's natural usage cycle has passed, not to everyone at once. Estimate that cycle from the median gap between sessions; a weekly tool and a quarterly tool need very different cadences.
6. Remind users of value they already created
Tactic. Send a periodic recap built from the user's own data. Spotify Wrapped is the reported pattern in Joy's roundup: the value is theirs, you just hand it back. Build the recap from events you already collect, so it costs no new tracking and reads as a summary of their work rather than an ad.
When to use. Usage is episodic and the natural cycle is longer than a week.
Metric. 30-day return rate of the dormant segment that received the recap.
7. Win back with their own history in the message
Tactic. A win-back message that quotes what the user created or left behind, not a generic discount. Netflix's reactivation campaigns are the reported pattern in Churnkey's roundup. This is the card the worked example below tests. Reference one concrete artefact — a project, a playlist, a saved report — so the message proves you remember them instead of blasting a list. Sequencing and timing for the whole campaign are in re-engagement campaign.
When to use. You have an activated-once dormant segment, like the 240 in the sample.
Metric. Win-back return rate against the natural baseline (10.0% versus 24.0% in the sample).
8. Reward the repeat action, not just the spend
Tactic. A loyalty program that rewards the repeat behaviour itself. Starbucks Rewards is the reported pattern in Joy's and Churnkey's roundups. Reward the next visit or the next completed action, not only the cumulative spend, so the incentive lines up with the habit you want to rebuild.
When to use. Purchase or usage cadence is regular and you can reward the next visit.
Metric. Repeat-purchase rate; member versus non-member retention (observational).
Examples for customers being pulled away
These users leave for a competitor or because the product stopped being worth switching back to. Cancels cite another tool, and usage drops before the cancel. Here the lever is raising the value of staying, not lowering the price of leaving.
9. Make the product better with every person they bring
Tactic. Referral and shared value, so leaving costs more than just the subscription. Dropbox's referral program is the reported pattern in Churnkey's roundup. The reward should add value inside the product — extra storage, a shared workspace — so each new person makes the original user's account harder to abandon.
When to use. The product has collaborative or multi-user value.
Metric. Referred new and returning users; retention by number of active collaborators.
10. Let people leave well, and leave a door open
Tactic. Graceful offboarding: an easy cancel, their data kept, and a way back. Calendly's offboarding is the reported pattern in Churnkey's roundup. A short offboarding checklist:
- Confirm what happens to their data, in plain words.
- Make the cancel path as short as the signup path.
- Leave one door open: an export plus a reactivation link.
When to use. Voluntary churn is high and you expect some users to return.
Metric. Post-offboarding return rate within 90 days.
Examples for customers stuck at payment
These users did not choose to leave; a failed charge or a budget squeeze ended the relationship. First split churn into involuntary (failed payment) and voluntary (active cancel) — the two groups need different cards, and mixing them hides which one is actually costing you revenue.
11. Recover failed payments before they become churn
Tactic. Retry the charge and remind the customer before and after a failure. Veed's involuntary-churn work is the reported pattern in Churnkey's roundup. Retry on a schedule rather than once, and tell the customer what failed and how to fix it; a silent decline often looks to them like a cancelled account.
When to use. Failed charges precede a material share of your cancels.
Metric. Involuntary share of churn, and payment recovery rate.
12. Offer a pause or a shorter pass instead of a cancel
Tactic. Let the user pause the plan or buy a short pass rather than lose them. Canva, Adobe and Spotify day-and-week passes are the reported pattern in Churnkey's roundup. Put the pause option on the cancel screen itself, so the user sees a cheaper way to stay before they confirm the exit.
When to use. Usage is seasonal, or cancels are budget-driven rather than product-driven.
Metric. Pause-versus-cancel ratio, and return rate after a pause.
Worked example: one win-back, before and after
Sample data, continuing the January cohort above. Of the 600 first-month losses, 240 had activated once and then gone dormant. We tested card 7 on that activated-once dormant segment, and used the next month's segment as the after group. The after cohort is the same definition — activated once, then 30 days inactive — so the only intended difference is the win-back message.
- January, no win-back: 24 of 240 returned within 30 days. 24 ÷ 240 = 10.0%.
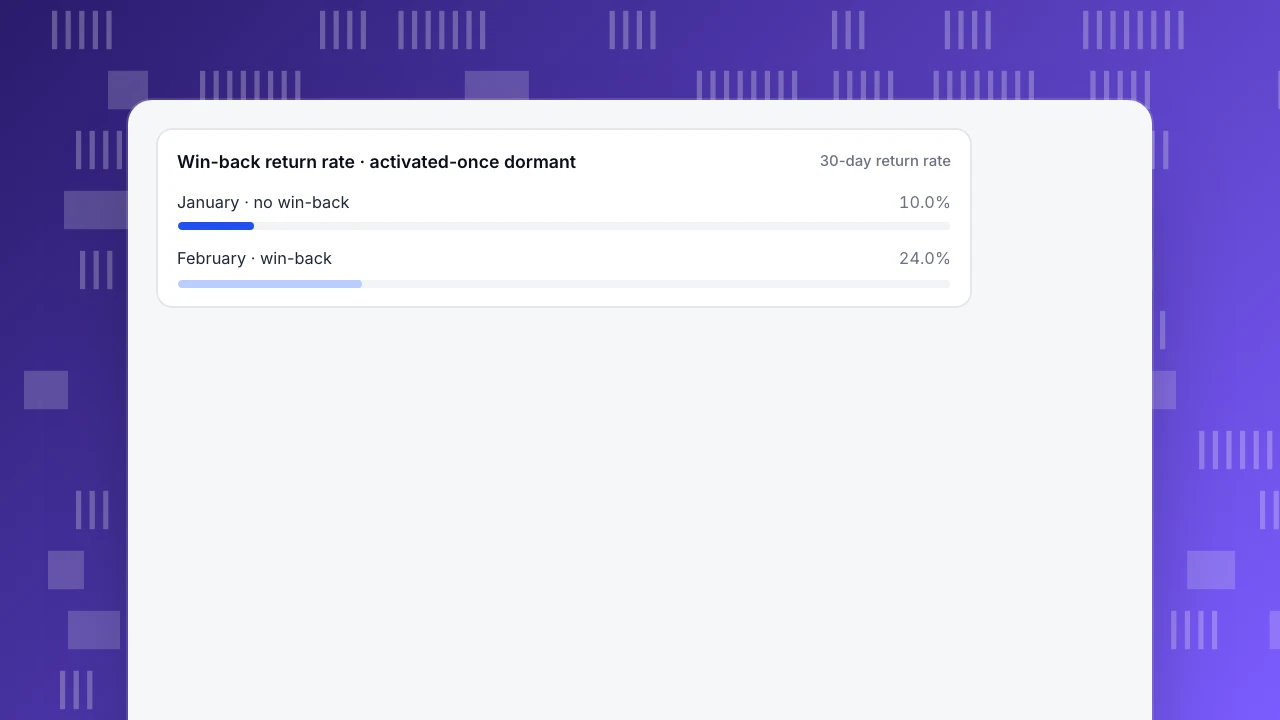
- February, win-back sent: 60 of 250 returned within 30 days. 60 ÷ 250 = 24.0%.
- Lift: 24.0 − 10.0 = +14.0 percentage points; 24.0 ÷ 10.0 = 2.4×.
- Natural baseline: at January's 10.0% rate, 250 × 10% = 25 would have returned anyway. Incremental returns: 60 − 25 = 35.
Report both numbers: +14.0 percentage points is the absolute change, 2.4× is the relative change. They answer different questions — the absolute change tells you how many more people came back, the relative change tells you how much the rate multiplied.
The chart below shows the two return rates. Read the gap with care: this is an observational before/after, not an experiment. January and February are different cohorts, channel mix and seasonality can differ, and some of the 35 would have returned without the message. Confirm with a third cohort before scaling. TapCub does not run A/B tests, so treat the gap as a signal to investigate, not proof of cause.
The win-back worked because it aimed at one reason — activated-once users who forgot — not at churn in general. The 360 who never activated would not have responded to the same message. That is the whole point of grouping examples by reason: the same effort aimed at the wrong group buys nothing.
Win-back return rate · activated-once dormant
30-day return rateHow to measure whether an example worked
Two formulas cover most of this. Customer retention rate (CRR) = (customers at the end of a period − new customers acquired during it) ÷ customers at the start; HubSpot's guide walks through it. Sample data: you start a month with 1,000 customers, acquire 300 new ones, and end with 1,150. CRR = (1,150 − 300) ÷ 1,000 = 850 ÷ 1,000 = 85.0%. The 300 new customers are subtracted so growth does not masquerade as retention.
For a cohort, retention at period N is the share of the starting group that returns in period N. Amplitude's retention docs define it as the start-event date compared with the return-event date; Mixpanel's retention docs compute it per birth cohort (day, week or month) and average the complete buckets. CRR answers "did the base hold"; cohort retention answers "did this group come back" — use the second one to judge a card.
Three rules keep a before/after honest:
- Same segment definition. "Activated once, then 30 days inactive" must mean the same thing in both periods.
- Same window. Compare 30-day returns with 30-day returns, not 30 with 60.
- Check channel mix. If the after cohort came from a different campaign, the gap may be the campaign, not the tactic.
Even with all three rules met, a before/after gap can overstate the effect: users who respond to a win-back may have been ready to return anyway. That is why a third cohort matters more than a bigger lift.
An example is worth copying only when it aims at the reason your own data shows: diagnose first, pick the card second, measure third. What counts as a good rate depends on your model and cohort; see good retention rate rather than chasing a single benchmark.
How to run this in TapCub
Run the same diagnosis and win-back inside TapCub. The point is to keep the diagnosis, the segment and the measurement in one place, so the card you pick is aimed at a reason you can see.
- Reproduce the curve. In All-platform analytics › Behavior › Behavior analysis, open retention, set the start event to sign-up and the return event to any activity, and read the monthly cohort. Retention shows whether a group comes back in period N, so the 40.0% to 16.0% January curve is this report.
- Locate the leak with lifecycle. The lifecycle view in the same builder gives weekly or monthly counts of New, Returning, Resurrecting and Dormant users. Dormant is drawn in the following period as a negative bar, and the current unfinished period is not judged. A big New bar with a small Returning bar the month after points at the never-reached-value group; a Returning bar that shrinks month after month, with Resurrecting flat, points at forgot and pulled-away. The four states are defined in customer lifecycle.
- Circle the 240. In All-platform analytics › Users › Segments & tags, build a rule segment — did the activation event, did no activity in the last 30 days — and use it as a cohort in retention and funnels. Rule segments refresh daily or on demand and keep a 30-day headcount trend, so you see the group grow or shrink. For paying customers, an RFM segment adds ten buckets from Champions to Hibernating and records moves between them (RFM). Anonymous visitors have no profile and do not enter segments, so identify logged-in users with
tapcub.login. - Send the win-back, and catch them on return. TapCub does not do email marketing: the card-7 message goes out through your own email tool, to the people in that segment. When they come back, Live chat › Chat settings › Proactive invites can greet visitors on the page the email links to after a set number of seconds, and in Live chat › Inbox the side panel shows their source and last two days of browsing, so the agent knows what they already tried.
- Measure the before and after. Run retention on January's segment and on February's with the same 30-day window — the 10.0% versus 24.0% comparison. To flag a slide early, save a custom metric (for example, unique users of your activation event) and watch it in All-platform analytics › Operations › Monitors; a dry run tells you how often it would have fired in the past 30 days, and it only notifies. TapCub runs no A/B tests, so the comparison stays observational.
FAQ
What is an example of customer retention?
A loyalty program that rewards repeat purchases, a win-back email that quotes what a user created, or a failed-payment retry flow — each is a retention example. The useful ones aim at a specific reason people leave. In the sample above, a win-back aimed at activated-once dormant users lifted 30-day returns from 10.0% to 24.0%.
What are customer retention strategies?
Strategies are the reason-grouped playbooks behind the examples: get users to value faster, remove friction, remind dormant users of what they built, make leaving costly, and recover failed payments. Pick by the signal in your own cohort and funnel data, not by whichever brand story sounds impressive.
How do you calculate customer retention rate?
CRR = (customers at the end of a period − new customers acquired during it) ÷ customers at the start. For a cohort, retention at period N is the share of the starting group that returns in period N. The worked example above computes both from raw counts so you can recheck the arithmetic.
What is a good customer retention rate?
There is no single number: it depends on your model, cohort and window. A rate that looks healthy overall can hide a first-month cliff. Compare against your own baseline and read the curve by period; what counts as good for your model is covered in good retention rate.
Can a CRM help with retention?
A CRM helps you remember who is at risk and follow up, but it does not show where people leak. TapCub is not a CRM; it measures retention, lifecycle and segments. The customer-success side of the workflow is covered in customer success strategy.
See also: Client Retention: Three Habits That Keep Clients (With the Numbers).
See also: Customer Appreciation: Specific, Timely and Checked Against a Holdout.
See also: Customer Incentive Programs: Types, Costs and How to Measure Them.
Sources
- Amplitude. Build a retention analysis. Amplitude Docs — retention compares the start-event date with the return-event date, with day, week or month intervals. Verified 2026-11-15.
- Mixpanel. Retention. Mixpanel Docs — retention per birth cohort (day, week, month); an unsegmented query averages complete buckets and can be expanded per cohort. Verified 2026-11-15.
- Reichheld, F. & Sasser, W. E. (1990). Zero Defections: Quality Comes to Services. Harvard Business Review, September–October 1990 — abstract verified; full text paywalled, no profit figures quoted. Verified 2026-11-15.
Was this article helpful?
We use your answers to fix and expand this page.
Couldn’t send. Please try again in a minute.
Thanks for the feedback. We’ll use it to improve this page.You’ve already sent feedback on this page. Thanks.

Product Adoption Consultant
Explores customer onboarding, live conversations, and self-service, turning common usage questions into practical guidance and improvements.