Try it on your own data
Every report in this article is in the free plan. One snippet for web and apps, up to 10 sites.
Start freeCustomer incentive programs are planned rewards such as coupons, points, referral rewards, free-shipping thresholds and early access. Judge each by cost per incremental retained customer: total incentive cost divided by the extra customers kept versus a holdout group. In our sample the coupon had the biggest lift and the thinnest payback. This guide shows the worked example, holdout sizing and how to track it.
What you will learn
- Measure cost per incremental retained customer against a random holdout, not redemption rate
- Biggest lift is not best payback: the sample 15% coupon lifted 14 points yet returned 24% on cost, against 433% for early access
- An incentive pays back only while its cost per incremental retained customer stays under what a retained customer is worth
What counts as a customer incentive program?
A customer incentive program is any planned reward you offer to change what customers do after they have bought: buy again, refer someone, stay subscribed or try a feature. Five types cover most of what small and mid-size businesses run:
- Discount coupon. A percentage or fixed amount off the next order.
- Loyalty points. Points earned per purchase and redeemed later for credit or products.
- Referral reward. A credit or gift when an existing customer brings a new one.
- Free-shipping threshold. Free delivery above a basket size, which nudges larger or more frequent orders.
- Early access or a gift. Early product access, a sample or a small gift that costs you little to give.
What does not belong here: paying people for reviews. The US Federal Trade Commission's rule on consumer reviews and testimonials (announced 14 August 2024) bans offering compensation or other incentives in exchange for reviews that express a particular sentiment, positive or negative, and the condition can be explicit or implied. If you reward reviews at all, take legal advice first; the reward cannot depend on what the review says. Retention rewards are different, and are what the rest of this guide measures. For the wider picture of loyalty design, see B2B loyalty programs; for what retention looks like in practice, see customer retention examples.
How do you measure what an incentive costs per retained customer?
The number to compute is the cost of each customer you would not have kept without the reward:
Cost per incremental retained customer = total incentive cost ÷ (retained in the rewarded group − retained you would have had anyway)
"Retained you would have had anyway" comes from a holdout: a similar group that received no incentive. Without it, every repeat buyer looks like a success of the program, including those who were coming back regardless.
Three parts of the cost are easy to miss:
- Subsidy to people who would have bought anyway. If 20% of customers repurchase with no reward and 60% of the rewarded group redeem a coupon, then about 120 of every 600 redemptions are subsidies to customers who were already coming back.
- Margin given up. A 15% coupon on an $80 order costs $12 of margin, not $12 of cash you were going to receive.
- Running cost. Points liability, fraud checks, support time and the software behind it. This guide leaves them out of the sample so the numbers stay checkable; add them in your own version.
Worked example: cost per retained customer for five incentives
Sample data: for each type, 1,000 customers are rewarded after a first purchase. A separate holdout group of 1,000 receives nothing, and 20% of them (200) buy again within 90 days. A retained customer is worth 2 more orders at $80 with a 40% gross margin: 2 × 80 × 0.40 = $64.
| Incentive | Repeat buyers (of 1,000) | Incremental retained | Incentive cost | Cost per incremental retained |
|---|---|---|---|---|
| Discount coupon, 15% | 340 | 340 − 200 = 140 | 600 redeemed × $12 = $7,200 | $51.43 |
| Loyalty points | 270 | 70 | 350 members redeeming × $4 = $1,400 | $20.00 |
| Referral reward | 240 | 40 | 120 rewards × $10 = $1,200 | $30.00 |
| Free-shipping threshold | 260 | 60 | 500 orders × $6 = $3,000 | $50.00 |
| Early access or gift | 250 | 50 | 200 gifts × $3 = $600 | $12.00 |
Now value each against the $64 a retained customer is worth:
| Incentive | Margin from incremental customers | Net of cost | Return on cost |
|---|---|---|---|
| Discount coupon | 140 × 64 = $8,960 | $1,760 | 24% |
| Loyalty points | 70 × 64 = $4,480 | $3,080 | 220% |
| Referral reward | 40 × 64 = $2,560 | $1,360 | 113% |
| Free-shipping threshold | 60 × 64 = $3,840 | $840 | 28% |
| Early access or gift | 50 × 64 = $3,200 | $2,600 | 433% |
Read the pattern, not the exact figures (all of this is sample data). The coupon has the biggest lift (14 points) and is the one that barely pays back, because its cost scales with every redemption, including the 120 who would have bought anyway ($1,440, or 20% of its cost). The cheap incentives earn the higher returns because they cost little per customer, even though they lift less. The break-even rule is simple: an incentive pays back only while its cost per incremental retained customer stays below what a retained customer is worth ($64 here). At the coupon's $51.43 there is just $12.57 of room; a small change in redemption or in the baseline would erase it.
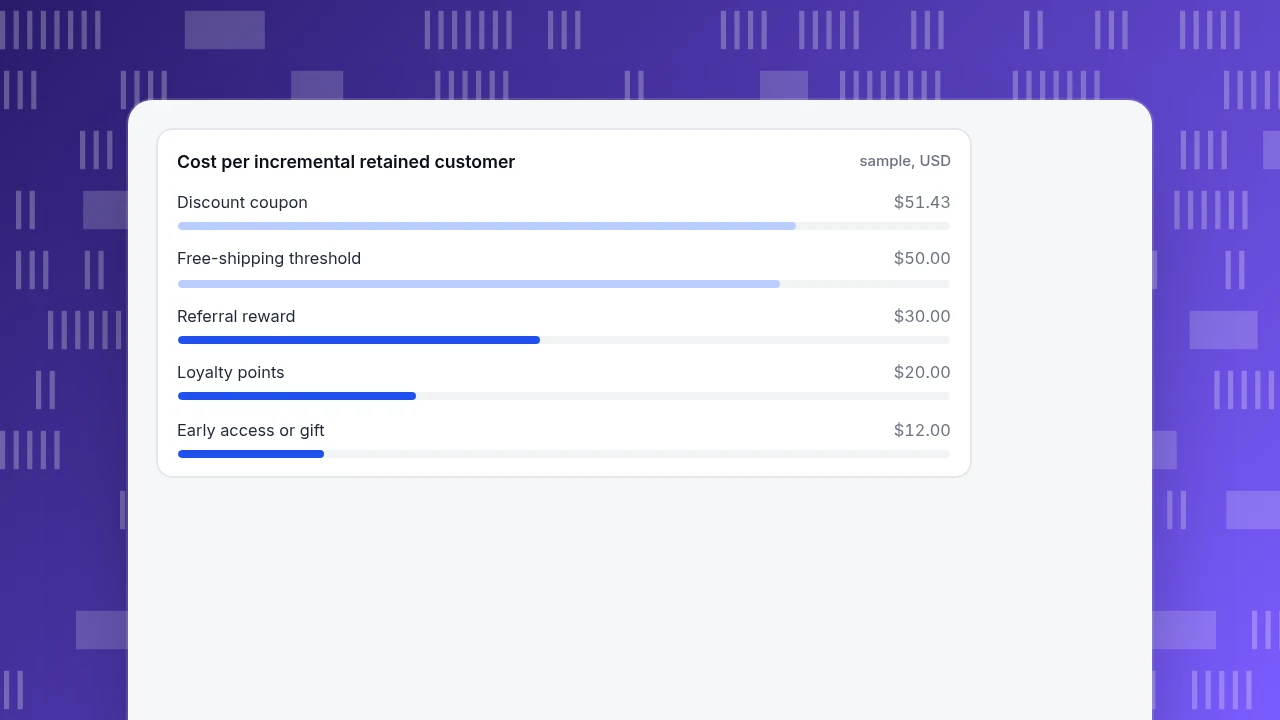
Cost per incremental retained customer
sample, USD| Incentive | Cost per incremental retained | Net of cost | Return on cost |
|---|---|---|---|
| Discount coupon, 15% | $51.43 | $1,760 | 24% |
| Loyalty points | $20.00 | $3,080 | 220% |
| Referral reward | $30.00 | $1,360 | 113% |
| Free-shipping threshold | $50.00 | $840 | 28% |
| Early access or gift | $12.00 | $2,600 | 433% |
Sample data: 1,000 rewarded customers per type against a 1,000-customer holdout with 20% repeat; a retained customer is worth $64 of margin.
How big a holdout do you need?
A holdout that is too small can make a good incentive look useless, or a weak one look good. A common rule of thumb for comparing two rates at 5% significance and 80% power is about 16 × p × (1 − p) ÷ d² customers per group, where p is the baseline rate and d is the smallest difference you care to detect.
With p = 0.20:
- To detect a 5-point difference (d = 0.05): 16 × 0.20 × 0.80 ÷ 0.0025 = 1,024 per group.
- To detect a 10-point difference (d = 0.10): 16 × 0.16 ÷ 0.01 = 256 per group.
In the sample above, each group has 1,000 customers. A two-proportion z-test of each lift against the 20% holdout gives: coupon z = 7.1, points 3.7, free shipping 3.2, early access 2.7 and referral 2.2. All clear the 1.96 cutoff, but the referral result (a 4-point lift) clears it narrowly. If you only had 400 customers per group, a 4-point lift would be well inside the noise. When your group is small, run the incentive longer, or accept that you can only detect bigger effects.
Rules for the holdout itself: choose it at random before sending, keep it free of other offers during the test, and measure both groups over the same window.
How do you design an incentive that does not give money away?
Four design choices, each with a reason:
- Reward the next action, not a past one. A discount on the next order changes behavior; a thank-you discount on an order already placed does not.
- Give a head start toward a goal. In a field experiment by Nunes and Drèze (2006), customers at a car wash received one of two loyalty cards. One needed eight stamps and started empty; the other needed ten stamps but came with two already stamped, so both needed eight paid washes. Of 300 cards distributed, the head-start card was completed more often and faster. Progress already made makes the goal feel closer at no extra cost.
- Set a threshold above the usual basket. If the average order is $55, free shipping at $50 rewards what customers already do. Free shipping at $65 asks for a little more; check how the average order moves.
- Put an end date or cap on it. A fixed window gives you a clean measurement period and limits cost if a reward is more popular than planned.
Gallup reports that fully engaged customers represent an average 23% premium over the average customer in share of wallet, profitability, revenue and relationship growth (Gallup, 22 July 2014). That figure is an association from Gallup's own database, not proof that an incentive creates engagement, so use it as a reason to measure and not as a forecast.
What mistakes make an incentive look better than it is?
- Counting all redeemers as retained. Redemption rate is not retention lift; compare with the holdout.
- Using revenue instead of margin. A $64 value comes from 40% margin, not $160 of revenue.
- Measuring too soon. If customers normally take 60 days to reorder, a 30-day window finds nothing. Match the window to your reorder cycle.
- Comparing against a different group. Customers who joined a program by choice are more engaged to begin with; compare against a random holdout, not non-members.
- Ignoring pull-forward. A coupon may bring an order forward from next month; track the following period, not just the promotion window.
How to track an incentive program in TapCub
TapCub does not send incentives, split customers into test groups or run a loyalty program. It measures what happens next on your site, app or mini program. The holdout design above is the job; here is how TapCub carries the measurement.
- Identify logged-in customers. Call
tapcub.loginwhen a customer signs in, so their visits appear as a person in All-platform analytics › Users › People, with a behavior timeline. - Make the two groups. Choose the rewarded and holdout groups at random in your own system. In All-platform analytics › Users › Segments & tags create a static segment for each by pasting the user IDs.
- Compare retention. In All-platform analytics › Behavior › Behavior analysis open Retention and use each segment as the group. The segment shows how many of each group come back in each later period.
- Mark the start. Add a date annotation under Configuration › Annotations on the day the incentive begins, so you can find it in the trend later.
- Put money on it. If the incentive has a cost, the numbers above (incentive cost ÷ incremental retained) are computed outside TapCub, with order counts from your store. If you import spend by day or campaign into All-platform analytics › Business › Channel ROI, the report calculates cost per click, cost per acquisition and return on ad spend.
Anonymous visitors have no profile, so they cannot be placed in a segment; incentive programs for logged-in customers fit this approach best.
FAQ
What are examples of customer incentive programs?
Discount coupons, loyalty points, referral rewards, free-shipping thresholds and early access or small gifts. Each has a different cost pattern: coupons cost per redemption, points cost when redeemed, referral rewards cost per successful referral.
How do you calculate the cost per retained customer?
Divide the total incentive cost by the extra customers retained compared with a holdout group. In the sample, a coupon cost $7,200 for 140 extra retained customers, or $51.43 each; points cost $1,400 for 70, or $20.00.
How do you know if an incentive program is working?
Compare the rewarded group with a random holdout over the same window, and check that cost per incremental retained customer is below the margin a retained customer brings. Redemption rate alone does not show it.
Is it legal to pay customers for reviews?
The FTC's 2024 rule bans offering incentives for reviews with a particular sentiment, explicitly or implicitly. Rewards for retention are a different matter, but check your local rules and get legal advice for your market.
How big should a holdout group be?
A rule of thumb is about 16 × p × (1 − p) ÷ d² per group. With a 20% baseline and a 5-point difference to detect, that is about 1,024 customers per group.
Sources
- US Federal Trade Commission, press release on the final rule banning fake reviews and testimonials (14 August 2024): ftc.gov
- Nunes, J. C. and Drèze, X., "The Endowed Progress Effect: How Artificial Advancement Increases Effort," Journal of Consumer Research, 2006, 32(4): doi.org
- Gallup Business Journal, Sorenson, S. and Adkins, A., article on why customer engagement matters (22 July 2014): news.gallup.com
Was this article helpful?
We use your answers to fix and expand this page.
Couldn’t send. Please try again in a minute.
Thanks for the feedback. We’ll use it to improve this page.You’ve already sent feedback on this page. Thanks.

Product Adoption Consultant
Explores customer onboarding, live conversations, and self-service, turning common usage questions into practical guidance and improvements.