Try it on your own data
Every report in this article is in the free plan. One snippet for web and apps, up to 10 sites.
Start freeCustomer experience vs customer journey: the journey is the path a customer takes to reach a goal, and customer experience is how that path felt. You need both, because stages that each work 90% of the time still let only 59.0% of customers finish a five-stage journey, and a stage can look fine on conversion while its error and frustration rates say otherwise. This guide maps each stage to its metrics and works one sample month through.
What you will learn
- The journey describes what happens and in what order; experience describes how it was; use the journey view to find the stage and experience evidence to diagnose it
- Per-stage success hides compounding: five stages at 90% each give 59.0% completion; look at the whole path
- Pair each stage with a behaviour signal, a perception measure and an outcome; in the sample, the lowest sentiment (Pay, 58.0) and the weakest moves (33.3%) named different stages to fix
What is the difference between customer experience and customer journey?
The customer journey is the sequence of steps a person takes to reach a goal over time, such as learning about a product, comparing options, signing up and paying. Customer experience (CX) is the whole of what that person thinks and feels about their interactions with the organisation along the way. Nielsen Norman Group describes a journey as the full, end-to-end process of a customer working toward a goal, and customer experience as all of a user's interactions with an organisation over time. In short: the journey is what happens and in what order; experience is how it was.
| Customer journey | Customer experience | |
|---|---|---|
| What it describes | The path: stages, actions, touchpoints | The perception: ease, trust, effort, feeling |
| Unit | A stage or a step | The whole relationship, or one interaction rated |
| How you see it | Funnels, reach and drop-off, page and event data | Surveys, support conversations, behaviour signals such as errors and exits |
| Typical question | Where do people go, and where do they leave? | How did that feel, and will they come back? |
| Typical fix | Remove a step, reorder, shorten | Fix the cause of friction, speed up, clarify |
They are not rivals. A journey map is a tool for studying experience: Nielsen Norman Group describes journey mapping as a way to get a holistic view of customer experience. You need both, because a path can be efficient and still feel poor, and a pleasant interaction can sit at a step where most people never arrive.
Why does it matter to look at both?
Looking at one interaction at a time hides how failures compound across the whole path. Sample data: a five-stage journey where each stage works for 90% of the people who reach it. Every individual touchpoint looks healthy at 90%. But 0.9 × 0.9 × 0.9 × 0.9 × 0.9 = 59.0% of visitors who start the journey complete it, and 41% do not. A team that reviews each step separately sees nothing below 90% and concludes that everything is fine.
The reverse also happens. A journey view tells you where people fall away, but not whether they left because the step was confusing, slow, too expensive or simply not for them. That needs the experience side: error and frustration signals, support questions, and what customers say. The two views answer different halves of the same question, so the working method is to find the stage with the journey view, then diagnose it with experience evidence.
How do journey stages map to CX metrics?
Choose a small set of metrics for each stage, in three kinds: a behaviour signal you can read from analytics, a perception measure that needs a question, and an outcome. The table below is a starting point, and the numbers are the documented thresholds and figures you can check yourself.
| Journey stage | Behaviour signal | Perception measure | Outcome |
|---|---|---|---|
| Discover | Landing-page load: Largest Contentful Paint within 2.5 s at the 75th percentile (Google); bounce and exit rate | "Did the page tell you what you needed?" | Visits to the next stage |
| Evaluate | Pages per session, comparison and pricing views, search use | Ease-of-finding rating | Reach rate to sign-up |
| Sign up or buy | Form errors, step drop-off; in checkout, extra costs were the top reason for leaving (40% of US shoppers surveyed by Baymard) | Customer effort rating | Conversion rate |
| Onboard | Time to first key action; rage clicks | Satisfaction after first use | Activation rate |
| Get help | First response time, resolution rate | Satisfaction (CSAT) after the conversation | Repeat contact rate |
| Renew or recommend | Return visits, usage frequency | Likelihood to recommend | Retention, referrals |
Two cautions. Do not read a number from a survey as the cause of a behaviour number: a low effort rating and a high drop-off at the same stage are two views of one problem, not two problems. And the Core Web Vitals thresholds apply to speed and responsiveness only: they say a page is fast enough, not that the customer is happy.
| Journey stage | Behaviour signal | Perception measure | Outcome |
|---|---|---|---|
| Discover | LCP within 2.5 s; exit rate | Did the page answer your question? | Visits to next stage |
| Evaluate | Pages per session; pricing and comparison views | Ease of finding information | Reach rate to sign-up |
| Sign up or buy | Form errors; step drop-off | Effort rating | Conversion rate |
| Onboard | Time to first key action; rage clicks | Satisfaction after first use | Activation rate |
| Get help | First response time; resolution rate | CSAT after the conversation | Repeat contact rate |
| Renew or recommend | Return visits; usage frequency | Likelihood to recommend | Retention; referrals |
Thresholds: Core Web Vitals LCP 2.5 s, INP 200 ms, CLS 0.1 at the 75th percentile (Google). Extra costs were the top abandonment reason for 40% of surveyed US shoppers (Baymard).
What does it look like on real stage data?
Sample data: one month of a software trial, with five stages defined as groups of pages and events. TapCub's journey map reports reach in sessions and a sentiment score derived from three behaviour rates: sessions with an error, sessions with a frustration signal (rage clicks) and sessions that exit on the stage's pages. The score is 100 minus 1.5 times the error rate, minus 1.5 times the frustration rate, minus 0.5 times the exit rate, with each rate as a percentage.
| Stage | Sessions | Reach vs first stage | Move to next stage | Error | Frustration | Exit | Sentiment |
|---|---|---|---|---|---|---|---|
| Discover | 20,000 | 100.0% | 45.0% | 1% | 2% | 35% | 78.0 |
| Evaluate | 9,000 | 45.0% | 33.3% | 2% | 3% | 40% | 72.5 |
| Sign up | 3,000 | 15.0% | 60.0% | 5% | 8% | 30% | 65.5 |
| Activate | 1,800 | 9.0% | 33.3% | 3% | 4% | 25% | 77.0 |
| Pay | 600 | 3.0% | 6% | 7% | 45% | 58.0 |
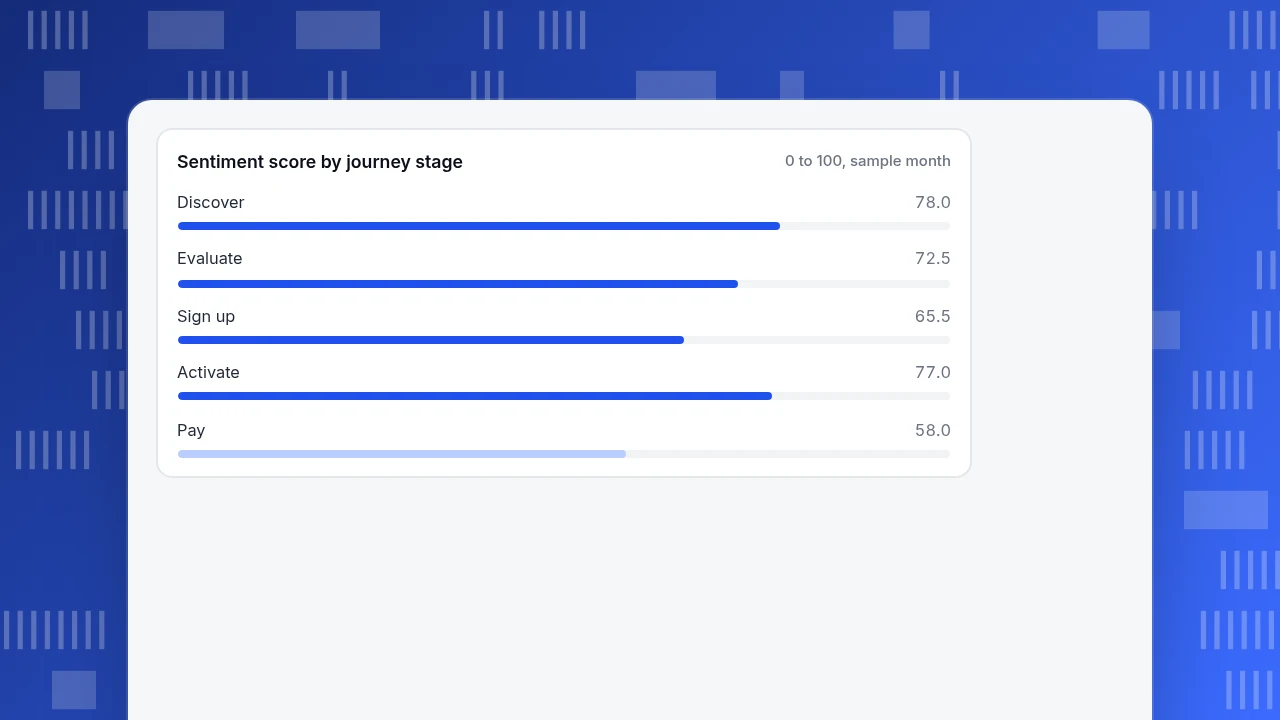
Recompute one: for Pay, 100 − 1.5 × 6 − 1.5 × 7 − 0.5 × 45 = 100 − 9 − 10.5 − 22.5 = 58.0. The journey view alone says the biggest loss is Discover to Evaluate (11,000 sessions). The experience signals say something different: the lowest sentiment is at Pay (58.0), then Sign up (65.5), which also has the highest frustration rate (8%); and the two weakest moves to the next stage (33.3% each) leave Evaluate and Activate. People who reach Pay have already decided, so lifting Activate to Pay from 33.3% matters per person more than another point of top-of-funnel traffic. The plan: diagnose Pay first (errors at 6%, exits at 45%), then Sign up.
The sentiment score is a behavioural proxy, not a survey. A stage with high sentiment and low reach can still be a bad experience for the people who never arrive.
Sentiment score by journey stage
0 to 100, sample monthHow do you build a journey map that improves customer experience?
Use six steps, and stop at the first one that blocks you.
- Pick one goal and one customer type. A journey that covers everyone and everything cannot be read. "A new trial user reaching their first report" is a journey; "the customer lifecycle" is a poster.
- List the stages in real order. Five to seven is workable. NN/g's journey phases are the high-level stages that structure the map. Name each by what the customer is trying to do, not by your internal team names.
- Attach a success event to each stage. The stage needs at least one page or event you can count. Without one, the stage exists on the map and nowhere in your data.
- Add one behaviour signal and one perception measure per stage. Use the table above as a starting list; pick what you will actually look at monthly.
- Mark the biggest loss and the lowest sentiment on the same chart. Where they coincide, you have your first fix. Where they diverge, find out why before acting.
- Name an owner per stage. A stage with no owner gets reviewed in nobody's meeting. The owner decides whether a drop is a journey problem (a missing step) or an experience problem (friction in a step).
For a longer treatment of building the map itself, see customer journey map; for the survey-side measures in the perception column, see customer experience metrics.
How do you see both in TapCub?
Take the trial journey above. TapCub covers the journey and the behavioural side of experience; it does not run NPS or CES surveys, so the perception column comes from your survey tool, or from chat satisfaction ratings.
- Open All-platform analytics › Business › Journey maps and click New journey. Add the stages in real order (up to 20; each needs at least one page or event, and pages can be exact paths or prefixes ending in
*). An industry pack can also install a ready-made journey that you can edit. - Pick the dates. Each stage shows sessions and users, the reach rate versus the first stage, and how many sessions moved on to the next stage. A move requires the same session to hit the stage first and the next one later.
- Read the sentiment. Each stage that has page patterns shows error, frustration and exit shares and the 0 to 100 score. When sentiment falls, see which of the three moved and open the top pages for that stage. A stage defined only by events scores those three as zero, so sentiment sits high there; that does not mean the experience was good.
- Check speed on the weak stage under Monitoring › Performance, which reports real-user Core Web Vitals, and look for errors in Monitoring › Errors.
- For the perception side, see satisfaction in Live chat › Reports for people who chatted, and ask the rest with your own survey tool. TapCub does not send surveys; it measures what visitors did.
FAQ
What is the difference between customer experience and customer journey?
The customer journey is the path a customer takes over time to reach a goal: its stages, actions and touchpoints. Customer experience is the customer's overall perception of their interactions along that path. The journey describes what happens; experience describes how it was.
Is the customer journey part of customer experience?
Yes, in practice. A journey map is a way of studying and improving experience, because it shows where the experience is made or broken. But experience also includes interactions outside any one mapped journey, such as support contacts or billing, so a journey does not cover all of CX.
How do you measure customer experience across the journey?
Use three kinds of measure per stage: behaviour (drop-off, errors, speed), perception (satisfaction, effort, likelihood to recommend) and outcome (conversion, retention). Behaviour tells you where and perception tells you why. In the sample, the lowest sentiment (58.0 at Pay) and the weakest step (33.3%) pointed at the same stage.
Which should you improve first, the journey or the experience?
Start with the journey view to find the stage with the biggest loss or lowest score, then use experience evidence to diagnose it. Fixing experience at a step few reach, or reshaping the path without knowing the friction, wastes effort.
What is an example of a customer journey and the experience at each stage?
A trial user: discover the product, evaluate it, sign up, activate, pay. Experience at discovery is page speed; at sign-up it is form errors and effort; at payment it is trust and costs (40% of surveyed US shoppers cited extra costs as a reason to abandon an order).
Sources
- Nielsen Norman Group. Journey Mapping 101 — journey map as a visualization of the process a person goes through to accomplish a goal; journey phases. Verified 2026-11-20.
- Nielsen Norman Group. Customer Journey Mapping — journey mapping as a holistic view of customer experience. Verified 2026-11-20.
- Nielsen Norman Group. UX vs CX — definitions of customer experience and customer journey. Verified 2026-11-20.
- Google. Web Vitals — LCP 2.5 s, INP 200 ms and CLS 0.1 thresholds at the 75th percentile. Verified 2026-11-20.
- Baymard Institute. Cart Abandonment Rate Statistics — reasons US shoppers gave for abandoning an order, including extra costs (40%). Verified 2026-11-20.
Was this article helpful?
We use your answers to fix and expand this page.
Couldn’t send. Please try again in a minute.
Thanks for the feedback. We’ll use it to improve this page.You’ve already sent feedback on this page. Thanks.

Customer Experience Consultant
Writes about live chat, visitor conversations, and self-service, sharing practical ways to make customer communication clearer and more effective.