Try it on your own data
Every report in this article is in the free plan. One snippet for web and apps, up to 10 sites.
Start freeGood customer experience examples are changes you can pair with a number: guest checkout and checkout completion, a delivery date and abandonment, a faster page and sales, a tracking page and support contacts. This guide gives ten of them with the metric behind each, outside figures you can check, and two recomputed worked examples showing how to prove a change worked.
What you will learn
- Count an example only when you can name the signal that moved: completion rate, first response, or contacts per 100 orders
- Compare against split traffic or a holdout before trusting a before-and-after lift; the sample checkout gain of 9.7% gives z about 4.5
- Pair any survey score with a behavior signal; only 6.7% of chats in one large report were rated
What makes a customer experience example worth copying?
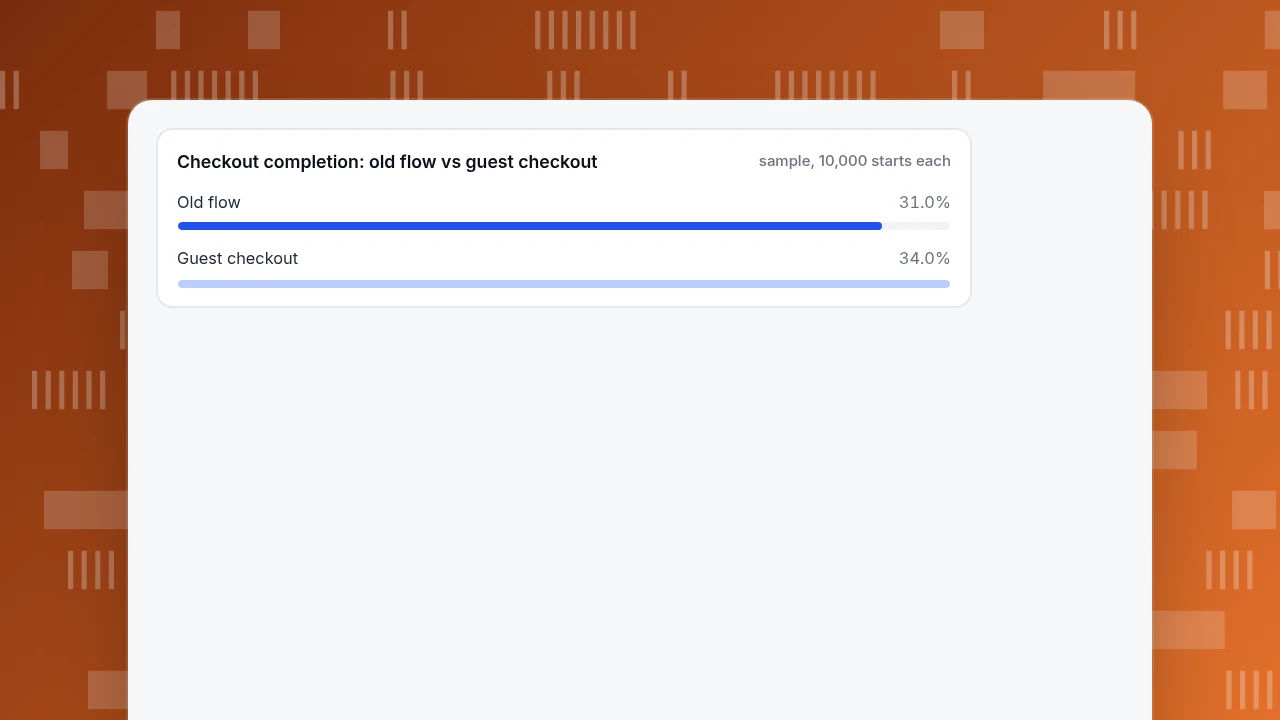
An example is worth copying only if you can name the number that moved. "We made checkout friendlier" is a story; "guest checkout lifted completed checkouts from 31.0% to 34.0% across 10,000 starts each" is evidence you can repeat or reject. So every example below is paired with the signal that shows whether it worked: a conversion rate, a response time, a repeat-contact rate or a satisfaction score.
Two rules keep this honest:
- No signal, no example. If you cannot measure the change, you cannot tell a good idea from a pleasant one.
- Compare against something. A before-and-after number without a comparison group may just reflect the season, a campaign or a different mix of visitors. The later sections show how to build the comparison.
The external numbers used here come from Baymard Institute (why shoppers abandon), a Vodafone page-speed test published on web.dev, LiveChat's service report and Gartner's cost-per-contact poll. They are cited so you can check them; the checkout and support worked examples are sample data. For the full metric definitions, see customer experience metrics; for the concept, the customer experience glossary entry.
Ten customer experience examples and the metric behind each
| # | Example | Signal to watch | Outside reference |
|---|---|---|---|
| 1 | Offer guest checkout, ask for an account after the order | Checkout completion rate | 18% of US shoppers abandoned because the site required an account (Baymard) |
| 2 | Show the full cost (shipping, tax, fees) before checkout | Cart-to-checkout rate | 40% abandoned over extra costs; 12% could not see the total up front (Baymard) |
| 3 | Show a delivery date before payment | Checkout completion by delivery option | 20% abandoned because delivery was too slow (Baymard) |
| 4 | Put the returns policy next to the price | Product-page-to-cart rate; "returns" contacts | 13% abandoned over an unsatisfactory returns policy (Baymard) |
| 5 | Show trusted payment options and security cues | Drop-off at the payment step | 19% did not trust the site with card details (Baymard) |
| 6 | Validate forms as the customer types | Form error rate, step-to-step drop-off | 17% abandoned because of website errors or crashes (Baymard) |
| 7 | Make the key page load faster | Largest Contentful Paint, cart-to-visit rate | 31% faster LCP came with 8% more sales in one test (Vodafone, web.dev) |
| 8 | Answer chat in under a minute | Average first response; resolution rate | 35 seconds average first response in LiveChat's report |
| 9 | Publish the answer where the question arises | Self-service resolution; contacts per 100 orders | Live channels averaged $8.01 per contact, self-service about $0.10 (Gartner, 2019) |
| 10 | Send a tracking page instead of making them ask | "Where is my order" contacts per 100 orders; repeat contact in 7 days | Sample data below |
Baymard's reasons come from a survey of US online shoppers; the page does not state the survey year or sample size. Use them to decide where to look, not as a promise of what a fix will deliver.
How much did friction at checkout cost: a worked example
Take example 1. Sample data: a store tests guest checkout against its old forced-account flow, 10,000 checkout starts each.
| Old flow | Guest checkout | |
|---|---|---|
| Checkout starts | 10,000 | 10,000 |
| Completed orders | 3,100 | 3,400 |
| Completion rate | 31.0% | 34.0% |
The absolute gain is 3.0 percentage points; the relative lift is 3.4 ÷ 3.1 − 1 = 9.7%. To check this is not noise, use a two-proportion z-test: the pooled rate is 6,500 ÷ 20,000 = 32.5%, the standard error is √(0.325 × 0.675 × (2 ÷ 10,000)) ≈ 0.0066, and z = 0.03 ÷ 0.0066 ≈ 4.5. That is far beyond the usual 1.96 cutoff for 95% confidence, so a gap this size on this volume is unlikely to be chance.
What it is worth: 300 extra orders per 10,000 starts at a $60 average order value is $18,000 of revenue, and at a 40% gross margin $7,200. The cost of the change (some developer time and a delayed account prompt) can then be compared with a real number, which is the point of pairing an example with a signal.
The sample is clean because the two flows ran at the same time on randomly split traffic. If you simply compare "this month" with "last month", you have no such guarantee.
Checkout completion: old flow vs guest checkout
sample, 10,000 starts eachWhat about speed: how much does a faster page change?
Example 7 has a published A/B test. In a case study dated 17 March 2021, Vodafone reported a 31% improvement in Largest Contentful Paint on a landing page. The test split paid-media traffic 50/50 between an optimized and an unoptimized version, each with about 34,000 visits a day, with the page speed work as the only difference. The optimized version showed 8% more sales, a 15% better lead-to-visit rate and an 11% better cart-to-visit rate.
Two cautions. This is one company, one page and one test, so treat it as proof that speed can move revenue, not a promise of 8% on your site. And the improvement was measured on the metric the visitor feels, not on a server number. For your own pages, record the current LCP first, make the change, and compare the same funnel step for a similar traffic mix.
How do support examples show up in the numbers?
Support examples 8 to 10 are measured by time, cost and repeat contact rather than conversion.
Fast first response. LiveChat's report puts the average first response at 35 seconds and the average chat at 8 minutes 25 seconds. Its satisfaction score is 64.2%, but that counts only chats customers rated, and only 6.7% of chats were rated. A score from so few chats says little about the rest, so pair satisfaction with a behavioral measure such as repeat contact.
Answer where the question arises. Gartner's poll found live channels cost an average of $8.01 per contact against about $0.10 for self-service. Writing the answer on the page where the question comes up moves contacts from the first column to the second.
Tracking page instead of "where is my order". Sample data: a shop ships 5,000 orders a month. 8% of orders (400) trigger a "where is my order" contact at $4.00 each, which is $1,600. A tracking link in the shipping email cuts that to 3% (150 contacts, $600). The saving is 250 contacts × $4.00 = $1,000 a month. The better signal to track is contacts per 100 orders: 8.0 before, 3.0 after.
Do not forget the reverse check. If contacts per 100 orders falls but repeat contact within 7 days rises, customers may have given up rather than been helped.
How do you prove an example worked?
Pick the strongest comparison you can run, in this order:
- Split traffic. Randomly show the old and new versions at the same time, as in the checkout and Vodafone examples. This removes season and campaign effects.
- Holdout. Keep a small share of customers on the old experience. Useful for emails and support changes where splitting a page is awkward.
- Before and after with a matched period. Compare to the same weeks last year, or to weeks with the same campaign mix. Weaker, so write down what else changed.
- Before and after, nothing else. Last resort. Mark the release date and treat any lift as a hint.
Whatever you choose, record three things before the change: the metric, the baseline value, and the size of change that would justify the work. Without the third, every small movement looks like success.
Which signals suit which example?
Match the signal to what the customer is trying to do:
| Customer is trying to | Primary signal | Back-up signal |
|---|---|---|
| Buy | Conversion rate at each funnel step | Time to complete |
| Get help | Resolution rate, first response | Repeat contact in 7 days |
| Understand something | Self-service resolution | Contacts per 100 orders |
| Come back | Repeat purchase or return visit rate | Churn |
Satisfaction scores and effort scores are useful, but they are surveys: they depend on who answers. See CSAT and customer effort score for how to read them, and keep a behavioral signal beside them.
| Customer is trying to | Primary signal | Back-up signal |
|---|---|---|
| Buy | Conversion rate at each funnel step | Time to complete |
| Get help | Resolution rate and first response | Repeat contact in 7 days |
| Understand something | Self-service resolution | Contacts per 100 orders |
| Come back | Repeat purchase or return visit rate | Churn |
Pick one primary signal per example and write down the baseline before the change.
How to measure these examples in TapCub
TapCub measures behavior on your site, so it can carry examples 1 to 10 except one thing: it does not split traffic for you, run surveys such as NPS or effort surveys, or change your checkout. Here is the checkout example run in TapCub.
- Define the goal. In Web analytics › Goals, set a goal for the order-confirmation page or event. The same data appears in All-platform analytics › Business › Goals.
- Build the funnel. In All-platform analytics › Behavior › Behavior analysis, make a funnel from product to cart to checkout to confirmation, and note where most visitors leave.
- Mark the release. Add a date annotation under Configuration › Annotations on the day you ship guest checkout, so a before-and-after comparison is easy to find later. Because TapCub does not split traffic, run the split in your own site tooling and compare the two groups with a property or event you send yourself.
- Watch speed and errors. Monitoring › Performance shows real-user page performance (Core Web Vitals) and Monitoring › Errors shows error count, error rate (errors ÷ page views), affected visitors and sessions.
- Check the support side. Live chat › Reports shows resolution rate, average first response and satisfaction (a 1 to 5 score after a conversation is resolved), and Conversion attribution compares goal conversion of visitors who chatted with those who did not. Remember that people who chat may differ from people who do not.
Bots are counted separately, so crawlers do not dilute your conversion rate.
FAQ
What are good examples of customer experience?
Guest checkout, showing total cost and delivery date before payment, fast-loading pages, quick chat replies, answers on the page where the question arises and proactive order tracking. Each is useful because it has a measurable signal such as checkout completion, first response or contacts per 100 orders.
How do you measure customer experience?
Pair each change with one behavior signal (conversion step rate, resolution rate, repeat contact) and, if you use them, a survey score. Record the baseline first and compare against a split group or matched period.
What is a good example of a bad customer experience?
Forced account creation, hidden shipping costs, slow delivery and checkout errors all appear in Baymard's reasons for abandonment: 18%, 40% (extra costs), 20% and 17% of surveyed US shoppers respectively.
Does page speed affect customer experience?
It can. In a 2021 Vodafone test published on web.dev, a 31% better Largest Contentful Paint came with 8% more sales. Treat it as one test, not a promise.
Is a satisfaction score enough to prove an example worked?
No. Scores depend on who responds: LiveChat's report counts only the 6.7% of chats that were rated. Add a behavior signal such as repeat contact.
Sources
- Baymard Institute, "Cart abandonment rate statistics" (reasons for abandonment among US online shoppers; average rate 70.22%, checked 2026-11-20): baymard.com
- web.dev, Vodafone case study (31% better LCP, 8% more sales; published 17 March 2021): web.dev
- LiveChat, Customer Service Report (35-second average first response, 8 minutes 25 seconds average chat, 64.2% satisfaction from rated chats; 2024 data): livechat.com
- Gartner, press release of 25 September 2019 ($8.01 per contact in live channels vs about $0.10 in self-service): gartner.com
Was this article helpful?
We use your answers to fix and expand this page.
Couldn’t send. Please try again in a minute.
Thanks for the feedback. We’ll use it to improve this page.You’ve already sent feedback on this page. Thanks.

Technical Engineer
Focuses on tracking code, SDKs, and API integrations, with practical guidance on implementation checks and troubleshooting.