Try it on your own data
Every report in this article is in the free plan. One snippet for web and apps, up to 10 sites.
Start freeCustomer engagement ideas work when each is tied to one metric: a welcome email to click rate, an onboarding checklist to activation, a chat invite to chats started. Define an engaged customer as someone with at least two meaningful actions in 30 days, try three ideas, and price each per added engaged customer. This guide lists twelve ideas with their metrics and a worked example.
What you will learn
- Define engagement as a rate (customers with at least two meaningful actions in 30 days) before choosing any idea
- Judge email by click rate, not opens: Mailchimp's all-users average click rate is 2.62%, and Apple's privacy features can inflate opens
- Price ideas per added engaged customer against a comparison group; effects overlap, so do not split the total movement among ideas
What does customer engagement mean in numbers?
Customer engagement is how often and how deeply existing customers take actions that matter to your business after the first purchase or sign-up. "Matter" is the important word: opening an email is not engagement; using the product, reading an answer that solves a problem, coming back to buy again or referring someone is.
Define it once, as a rate you can track. A workable definition for a small business: engaged customers = customers who completed at least two meaningful actions in the last 30 days, divided by all active customers. "Meaningful" is your list: a purchase, a login, a key feature used, a help article read to the end, a chat started. Write the list down before choosing any idea, because every idea below is judged by whether it moves that rate or one of the actions in it. The metrics themselves are covered in customer engagement metrics; how engagement works across email, chat and site together is in omnichannel engagement.
Why bother? Gallup reports that a fully engaged customer represents an average 23% premium in share of wallet, profitability, revenue and relationship growth compared with the average customer, and an actively disengaged one a 13% discount (Gallup, 22 July 2014). The article does not give the sample or method behind those figures, and they describe an association, not proof that an activity creates engagement. They are a reason to measure engagement, not a forecast of what an idea will earn.
Twelve customer engagement ideas and the metric to watch for each
| # | Idea | Metric to watch | Why it should move |
|---|---|---|---|
| 1 | Welcome email within the hour of sign-up, one link to one first action | Click rate; first-action rate | The customer is most attentive right after signing up |
| 2 | Onboarding checklist of three steps inside the product | Activation rate (share completing the key step) | Shows the shortest route to first value |
| 3 | Behavior-triggered tip email (sent after a feature is not used for 14 days) | Feature adoption rate | Relevant to what the customer did or did not do |
| 4 | Proactive chat invite on a pricing or checkout page after a set time | Chats started; conversion of visitors who chatted | Answers a doubt at the moment it appears |
| 5 | Help-center article at the point of need (linked from the form or error) | Self-service resolution; contacts per 100 customers | Saves the customer a wait |
| 6 | Ask one question after a chat is resolved | Rating response rate | Gives you a signal and tells the customer you listen |
| 7 | Early access for active customers | Repeat rate; share of early-access users who return | Rewards use |
| 8 | Win-back message to customers inactive for 60 days | Reactivation rate | Reaches people before they are gone |
| 9 | Referral prompt right after a success moment | Referral rate | Asks when satisfaction is highest |
| 10 | Personal check-in for your top 20 accounts each quarter | Account health score; renewal rate | Human contact where the revenue is |
| 11 | Faster load on the first page customers see | Largest Contentful Paint; cart-to-visit rate | Friction removed on every visit |
| 12 | Live Q&A or webinar on a common problem | Attendance rate; follow-up purchase or use | Teaches and builds a relationship |
Do not run all twelve. The sections below show how to price them and choose three.
What do real benchmarks say about email engagement?
Email is the idea with the most public data. Mailchimp's benchmarks page (data last updated December 2023) lists an average open rate of 35.63%, an average click rate of 2.62% and an unsubscribe rate of 0.22% across all users; for ecommerce it lists 29.81% open, 1.74% click and 0.19% unsubscribe. Mailchimp warns that open rates may be affected by Apple's Mail Privacy Protection and that these figures can differ from those inside its app.
Use the click rate, not the open rate, as your engagement signal. Opens can be inflated by privacy features that load images automatically, so a rising open rate may not mean more people read the message.
A quick comparison: you send a welcome series to 10,000 new customers and 340 click (3.4%). The all-users average click rate is 2.62%, so the benchmark would give about 262 clicks. Your result is 3.4 ÷ 2.62 − 1 = 29.8% above that average. The comparison is crude (different lists, different goals), so treat a gap of a few points as noise and a persistent shortfall, such as 1.0% against 2.62%, as a prompt to look at the offer, the link and the timing.
For speed, a Vodafone test published on web.dev on 17 March 2021 split paid traffic 50/50 between an optimized and an unoptimized page, each with about 34,000 visits a day. The 31% LCP improvement went with 8% more sales and an 11% better cart-to-visit rate. That is evidence that removing friction on the first page changes behavior; whether your site gets the same lift is for your own test to tell you.
| Mailchimp benchmark (Dec 2023) | Open rate | Click rate | Unsubscribe rate |
|---|---|---|---|
| All users | 35.63% | 2.62% | 0.22% |
| Ecommerce | 29.81% | 1.74% | 0.19% |
Opens can be inflated by Apple's Mail Privacy Protection; use clicks as the engagement signal.
Worked example: raising the engaged-customer rate
Sample data: a store has 1,000 active customers. With the definition above (at least two meaningful actions in 30 days), 280 are engaged, so the rate is 28.0%. The team tries three ideas over 60 days and the rate moves to 360 of 1,000, or 36.0%: 80 more engaged customers.
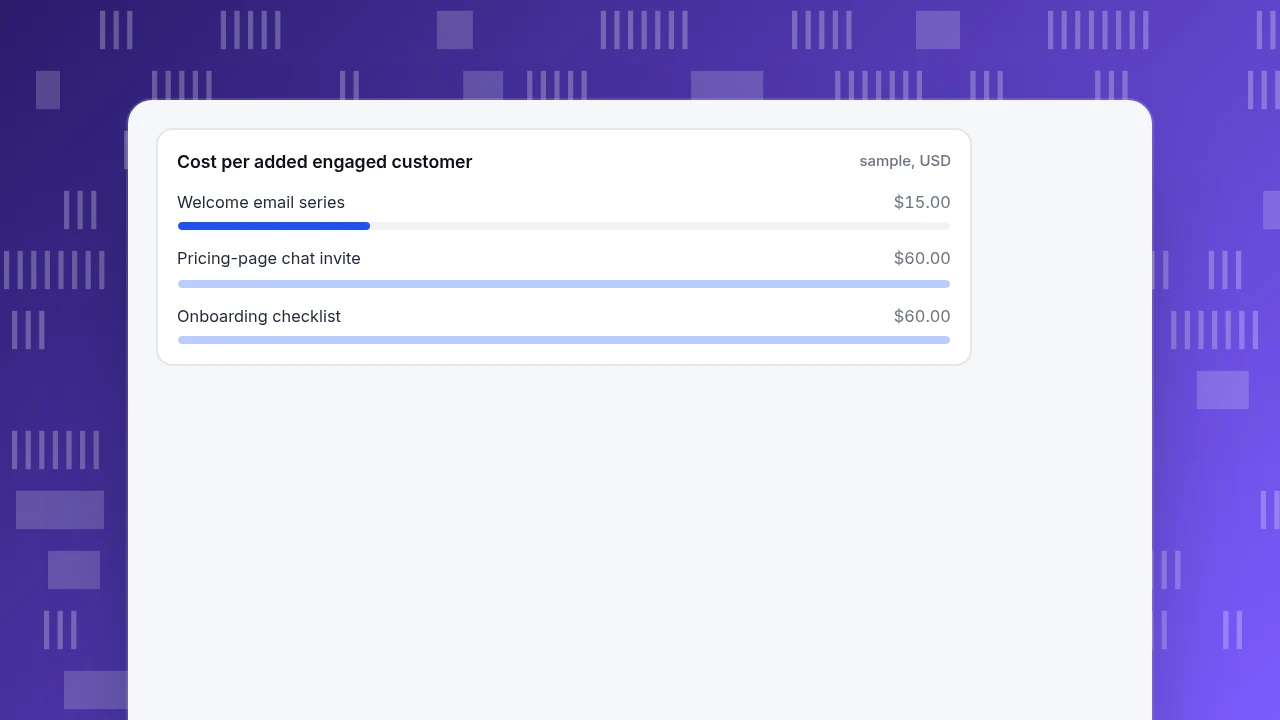
To price each idea, divide its cost by the engaged customers it added (estimated by comparing exposed customers with a similar group that did not get it). Sample data again:
| Idea | Cost | Added engaged customers | Cost per added engaged customer |
|---|---|---|---|
| Welcome email series (idea 1) | $600 setup | 40 | $15.00 |
| Pricing-page chat invite (idea 4) | $900 of agent time | 15 | $60.00 |
| Onboarding checklist (idea 2) | $1,500 developer time | 25 | $60.00 |
| Total | $3,000 | 80 | $37.50 |
The three added customers sum to 80, matching the total movement from 280 to 360. In real data they will not add up so neatly, because the effects overlap, which is why each idea needs its own comparison group instead of dividing the total movement among ideas. In this sample the welcome series is four times cheaper per added customer than the other two, which tie at $60.
What is the 80 worth? If each engaged customer spends $200 a year and you applied Gallup's 23% premium, the extra would be 80 × $200 × 0.23 = $3,680. Treat that as an upper-end illustration only: Gallup's figure is an association, and customers who were going to be engaged anyway would show the same premium. A more cautious plan uses your own data: compare the actual spend of engaged and non-engaged customers last year and use that gap.
Cost per added engaged customer
sample, USDHow do you pick which ideas to try first?
Rank the ideas using three questions, in this order:
- Can I measure it within 30 days? An idea with a metric that needs six months to read cannot be iterated. Prefer ideas 1, 2, 4, 5 and 11, which show results within weeks.
- What does it cost per added engaged customer, using my own numbers? Use the table above as a template. An idea at $13 beats one at $40 only if its reach is similar; check the total added customers as well.
- Does it depend on a channel I already run? Ideas that reuse your email list, your site or your chat start faster than ideas that need a new channel.
For a small team, a sensible first three are a welcome email (idea 1), a proactive chat invite on one high-intent page (idea 4) and a help-center article at the most common point of confusion (#5). Together they cover email, chat and self-service without a new tool.
Which mistakes make engagement efforts look better than they are?
- Counting opens and likes as engagement. Check that the metric is an action that matters to the business.
- Comparing exposed customers with everyone else. Customers who click or chat are already more interested; compare with a similar group that did not receive the idea.
- Changing three things at once. You cannot say which worked, as the overlap in the example above shows.
- Chasing the average. A benchmark is a reference for scale. Your own baseline last month matters more.
- Over-messaging. Mailchimp's unsubscribe rate of 0.22% is a reminder that every send has a cost. Watch unsubscribes and complaints beside clicks.
How to measure engagement ideas in TapCub
TapCub measures what customers do on your site, app and mini program, and runs live chat. It does not send marketing email or push, run surveys or split customers into test groups, so the sending and the test design stay in your own tools. Here is how to measure the example.
- Define the actions. Send the meaningful actions as events (All-platform analytics › Data › Events & properties), and call
tapcub.loginon sign-in so logged-in customers show up under All-platform analytics › Users › People. - Build the engaged group. In All-platform analytics › Users › Segments & tags, create a rule segment: did event A and event B at least twice in the last 30 days (conditions include "did" and "did not"). It refreshes daily, and the segment keeps a 30-day trend of its size. That trend is your engaged-customer count.
- Test the chat invite. In Live chat › Chat settings › Proactive invites set the trigger by page and seconds on page. In Live chat › Reports › Conversion attribution compare visitors who chatted with those who did not, and check the warning shown when fewer than 30 chatted. Selection bias applies, so treat it as an upper bound.
- Read email results with UTM. Tag email links with UTM parameters and read Web analytics › Sources for visits and goals by campaign.
- Track speed. Monitoring › Performance shows real-user page performance (Core Web Vitals), so you can see whether the first page loads faster after a change.
FAQ
What are good customer engagement ideas?
Welcome emails, onboarding checklists, behavior-triggered tips, proactive chat on high-intent pages, help-center articles where questions arise, a one-question rating after chat, early access, win-back messages and referral prompts. Choose each by the metric it should move.
How do you measure customer engagement?
Define meaningful actions, then track the share of active customers who completed at least two in 30 days. Add the metric of each idea you try, such as click rate or activation rate.
What is a good email click rate?
Mailchimp's benchmarks page (December 2023 data) lists an average click rate of 2.62% for all users and 1.74% for ecommerce. Opens are less reliable because of Apple's Mail Privacy Protection, so use clicks.
Does customer engagement increase revenue?
Gallup reports that fully engaged customers represent an average 23% premium in share of wallet, profitability, revenue and relationship growth. That is an association from Gallup's data, not a guarantee, so test your own ideas against a comparison group.
How many engagement ideas should you try at once?
Start with three that use channels you already run and have metrics readable in 30 days. More than that and you cannot tell which one worked.
Sources
- Gallup Business Journal, Sorenson, S. and Adkins, A., article on why customer engagement matters (22 July 2014): news.gallup.com
- Mailchimp, "Email marketing benchmarks" (data last updated December 2023, checked 2026-11-20): mailchimp.com
- web.dev, Vodafone case study (31% better LCP, 8% more sales; 17 March 2021): web.dev
Was this article helpful?
We use your answers to fix and expand this page.
Couldn’t send. Please try again in a minute.
Thanks for the feedback. We’ll use it to improve this page.You’ve already sent feedback on this page. Thanks.

Product Experience Specialist
Explores usability, user journeys, and feature adoption through practical examples of onboarding and everyday product use.