Try it on your own data
Every report in this article is in the free plan. One snippet for web and apps, up to 10 sites.
Start freeCustomer engagement metrics are useful only if they predict retention or revenue, so choose them by testing, not by list. This guide groups metrics by activity, depth, sentiment and outcome, shows how to check which one separates customers who stay from those who leave, and uses a recomputed cohort in which 25% of customers produce 47.9% of 90-day revenue.
What you will learn
- A metric is engagement only if higher values go with better retention or revenue; test each one
- Compare candidate behaviours against 90-day retention: in the sample, teammate invites separated stayers by 49 points, email opens by 4
- Turn the metric into bands with an action: engaged, watch, at risk
What are customer engagement metrics, and what must they prove?
Customer engagement metrics measure how customers interact with your product, site or support: how often, how deeply and how they feel about it. They are only useful if they predict something you care about. An interaction that does not relate to staying or paying is activity, not engagement. So the test for every metric in this guide is the same: does a higher value go with better retention or revenue?
Most lists of engagement metrics stop at definitions and leave you to guess which ones matter. This one gives you the definitions, then a method for checking which of them actually predict retention in your own data. For the broader family of measures, see engagement metrics; for what happens to engagement over a customer's life, see customer lifecycle metrics.
Which engagement metrics are worth knowing?
Group them by what they measure. The formulas are standard; the point is to choose a few from different groups.
| Group | Metric | Formula or definition | What it tells you |
|---|---|---|---|
| Activity | Active days per period | Days with any activity in the period | How often they come |
| Activity | Stickiness (DAU ÷ MAU) | Daily active users ÷ monthly active users | Share of monthly users who are daily |
| Depth | Feature adoption | Users of a feature ÷ active users | How much of the product they use |
| Depth | Engaged session rate | Engaged sessions ÷ sessions | Share of visits that were real visits |
| Sentiment | Net Promoter Score | % promoters (9 to 10) − % detractors (0 to 6) | Willingness to recommend |
| Sentiment | CSAT | Satisfied responses ÷ responses | How a specific interaction went |
| Outcome | Repeat purchase or renewal rate | Customers who buy again ÷ customers | The behaviour you want |
Two definitions worth checking against their source. Google Analytics 4 counts a session as engaged if it lasted longer than 10 seconds, had a conversion event, or had at least two page views, and engagement rate is engaged sessions divided by sessions. And the Net Promoter Score comes from Frederick Reichheld's Harvard Business Review article, which proposed asking customers how likely they are to recommend the company and argued the answer relates to growth. Sample stickiness: 1,200 daily users ÷ 6,000 monthly users = 20%.
How do you check which metric predicts retention?
For each candidate, split customers into those who did it (or scored high) and those who did not, then compare how many were still customers 90 days later. Sample data for 1,000 customers:
| Candidate metric (first 30 days) | Retained at 90 days: high | Retained at 90 days: low | Gap |
|---|---|---|---|
| Opened 3 or more emails | 47% | 43% | 4 points |
| 5 or more sessions | 62% | 31% | 31 points |
| Invited at least one teammate | 78% | 29% | 49 points |
Email opens barely separate stayers from leavers. Teammate invitations separate them sharply. If you were tracking "emails opened" as your engagement metric, you would be steering by a number that says almost nothing about retention.
Cautions: this shows association, not cause (keen customers do more of everything); each group needs enough customers, at least a few hundred in total, or the gaps will swing; and a metric that predicts retention today may stop predicting after you push people to game it. Re-run the check each year.
| Group | Metric | Formula |
|---|---|---|
| Activity | Active days per period | Days with any activity |
| Activity | Stickiness | Daily active ÷ monthly active users |
| Depth | Feature adoption | Users of a feature ÷ active users |
| Depth | Engaged session rate | Engaged sessions ÷ sessions |
| Sentiment | Net Promoter Score | % promoters (9 to 10) − % detractors (0 to 6) |
| Outcome | Repeat purchase or renewal | Customers who buy again ÷ customers |
Choose a few from different groups, then test each against retention.
How do engagement and revenue connect? A worked example
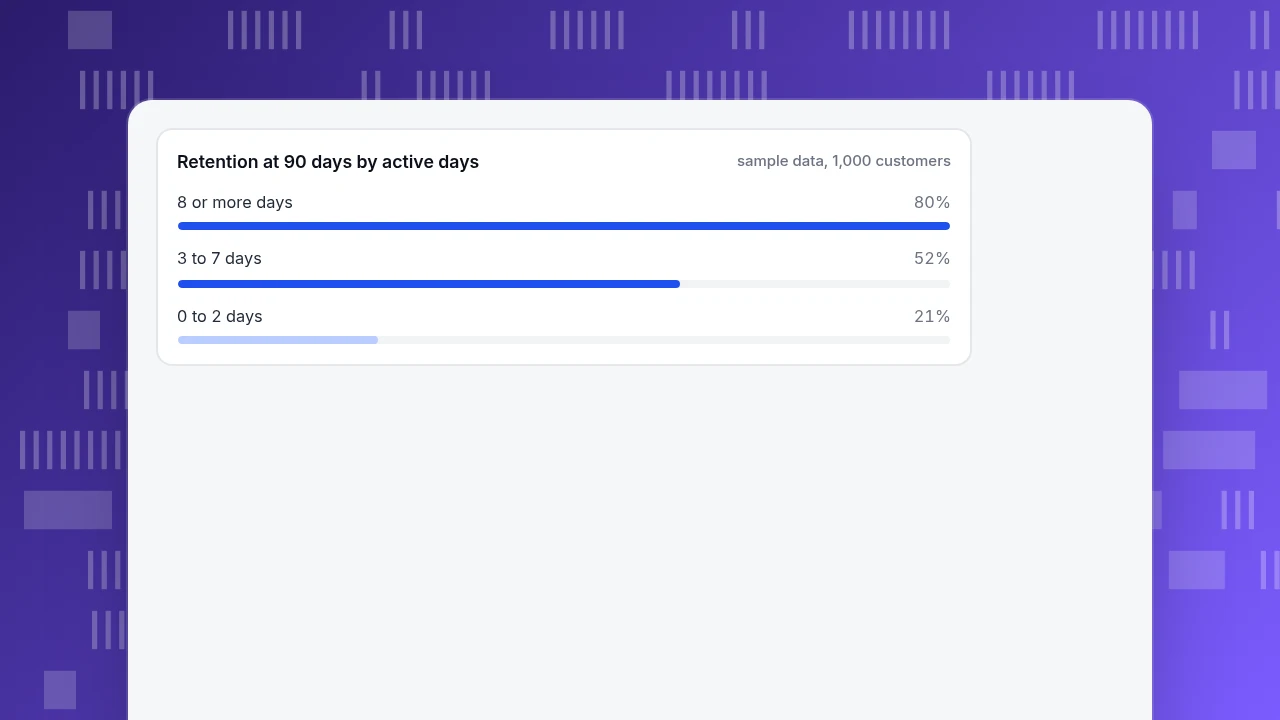
Sample data for a cohort of 1,000 new customers, grouped by active days in their first 30 days. Retention is customers still active at day 90, and revenue is average revenue per customer over 90 days.
| Active days in first 30 | Customers | Retained at 90 days | Retained customers | Avg 90-day revenue per customer | Group revenue |
|---|---|---|---|---|---|
| 0 to 2 | 400 | 21% | 84 | $12 | $4,800 |
| 3 to 7 | 350 | 52% | 182 | $36 | $12,600 |
| 8 or more | 250 | 80% | 200 | $64 | $16,000 |
| Total | 1,000 | 46.6% | 466 | $33,400 |
The 250 customers with 8 or more active days (25% of the cohort) produce $16,000 of $33,400, or 47.9% of 90-day revenue, and retain at 80%. The 400 with 0 to 2 active days (40% of the cohort) produce $4,800, or 14.4%, and 21% remain.
That turns "active days" from a vanity number into a decision tool: the customers in the middle band (3 to 7 days, 350 people) are the group where a nudge can matter most, because they are neither lost nor locked in. If an onboarding change moved 50 customers from the middle band to the top, the expected extra revenue in this sample is 50 × ($64 − $36) = $1,400 over 90 days. That is an upper bound, since the customers a nudge moves are likely less committed than those who got there unaided.
Retention at 90 days by active days
sample data, 1,000 customersHow do you turn a metric into a health rule?
A metric becomes useful when it has thresholds and an action:
| Band | Rule (sample) | Action |
|---|---|---|
| Engaged | 8 or more active days in 30 | Ask for a referral or review; protect the experience |
| Watch | 3 to 7 active days | Send a relevant tip; offer help with the feature that predicts retention |
| At risk | 0 to 2 active days after day 14 | Personal outreach for high-value accounts, automated message for others |
For business-to-business accounts, a score across several people is stronger than any single user's activity: a company where only one person logs in is fragile, however active that one person is. Count active members per account as well as active days.
Should every customer type use the same threshold?
Usually not. The same cohort split by plan shows why. Sample data for the 250 customers with 8 or more active days:
| Plan | Customers | With 8 or more active days | Share of plan | Of those, retained at 90 days |
|---|---|---|---|---|
| Self-serve | 700 | 105 | 15.0% | 80 of 105 (76.2%) |
| Team plan | 300 | 145 | 48.3% | 120 of 145 (82.8%) |
| Total | 1,000 | 250 | 25.0% | 200 of 250 (80.0%) |
A single company-wide rule of "8 or more days" flags 15% of self-serve customers as engaged and 48.3% of team customers, because teams naturally log in more often. If you used the blended 25% as the bar for both, you would label most self-serve customers at risk when their normal pattern is lighter use. Set the threshold per segment: for each plan, find the active-day level where retention jumps, and use that.
Two more habits keep the numbers honest. Recompute the thresholds when you change the product, because a new feature shifts what normal use looks like. And report the share of customers in each band over time rather than one average, so a shrinking "engaged" band shows up before revenue does.
What are the most common mistakes with engagement metrics?
- Counting activity, not value. Logins, opens and page views that do not predict retention.
- Never checking the link to retention. Test every metric against 90-day outcomes.
- Using one metric. Combine activity, depth and sentiment; each misses something.
- Averaging. An average of 3 active days can be one group at 0 and one at 6, which need opposite actions.
- Chasing the number. Pushing notifications to lift active days can lift opt-outs and complaints.
- Treating NPS as a causal lever. It is a signal of sentiment; changing the survey changes the score, not the loyalty.
- One threshold for every plan. It mislabels naturally light users as at risk and hides decline among heavy users.
- Forgetting accounts. In B2B, engagement is per company as much as per person.
How to measure customer engagement in TapCub
Use the cohort above. TapCub measures what people do in your product, site and chat; it does not send surveys such as NPS or run notification campaigns, so sentiment scores from surveys stay in your survey tool. The steps:
- See how often they come. In All-platform analytics › Behavior › Behavior analysis, choose Lifecycle and read stickiness: the number of people active on N days in the week or month, with their share. This is "active days" without exporting anything.
- Check whether they come back. In the same place, the retention report shows, for a cohort, how many are still active on period N; choose a start event (for example sign-up) and a return event (for example your key action). The line under the table is the size-weighted average rate.
- Compare the behaviours. In All-platform analytics › Behavior › Event analysis, build a metric per candidate behaviour (users who invited a teammate, sessions per user). All-platform analytics › Users › Segments & tags lets you define the high-engagement group once (people who did an event, active on a number of days), then use it in other analyses.
- Read the account view for B2B. After login, call
tapcub.group('company', 'acme', {...}), then All-platform analytics › Users › Accounts shows account counts, 30-day active accounts, members and a 0 to 100 health score. Healthy means many active members (40 points), many active days (30) and recent presence (30 for the last 7 days, 15 for 30 days). It is an organisation view, so it cannot open person-level detail or take a segment. - Add support sentiment. Live chat › Reports shows satisfaction and the knowledge base hit rate; it covers chat interactions, not product-wide NPS.
- Know the boundary. TapCub does not send NPS or CES surveys and does not trigger messages; it reports the behaviour and the retention that follows.
FAQ
What are customer engagement metrics?
Measures of how customers interact with a product, site or support: activity (how often), depth (how much), sentiment (how they feel) and outcome (whether they stay or buy again). They are useful only if they predict retention or revenue.
What are the best customer engagement metrics to track?
Pick a few across groups: active days, a depth measure such as feature adoption, a sentiment score and repeat purchase or renewal. Then test each against 90-day retention in your own data and keep the ones that separate stayers from leavers.
How do you measure customer engagement?
Define active, count it per period, track how many return, and compare behaviours with later retention and revenue. For accounts in B2B, also count active members per account.
What is a good engagement rate?
It depends on how engagement is defined, so compare only like with like. In Google Analytics 4, engagement rate is engaged sessions divided by sessions. Track your own trend and whether it moves retention.
How is customer engagement different from customer satisfaction?
Engagement describes behaviour (what customers do); satisfaction describes feeling (what they say). Both matter, and they can disagree: a customer who uses a product daily can still be unhappy with it.
See also: Customer Engagement Ideas: 12 Tactics With the Metric for Each.
Sources
- Google Analytics Help. Engagement rate and bounce rate. Engaged session definition.
- Frederick F. Reichheld. The One Number You Need to Grow. Harvard Business Review, December 2003; origin of the Net Promoter Score question.
Was this article helpful?
We use your answers to fix and expand this page.
Couldn’t send. Please try again in a minute.
Thanks for the feedback. We’ll use it to improve this page.You’ve already sent feedback on this page. Thanks.

Product Experience Specialist
Explores usability, user journeys, and feature adoption through practical examples of onboarding and everyday product use.