Try it on your own data
Every report in this article is in the free plan. One snippet for web and apps, up to 10 sites.
Start freeCustomer experience analytics puts three kinds of evidence side by side (what people did, how they scored the experience and what they asked support) to find the stage where they stall or leave. Behaviour shows where, conversations show why, scores show how it felt. In the sample checkout below, no single source found the problem; all three together did, and sized the fix.
What you will learn
- Behaviour says where, conversations say why, scores say how it felt; use them together, not one at a time
- Look for the stage that loses the most people, not the one with the lowest percentage
- Finish with a sized fix and a re-measurement, not a dashboard of scores
What is customer experience analytics?
Customer experience analytics is the practice of putting three kinds of evidence side by side (what people did, what they said and what they asked support) to find the specific places where the experience makes them stop, struggle or leave. Each source alone is misleading. Behaviour shows where people drop but not why. Survey scores show how people felt but not where. Conversations show why, but only for the few who write in.
The aim is a short list of fixes, each tied to a place in the journey and a size. It is not a dashboard of scores. If you want the scores themselves and what counts as a healthy number, see customer experience metrics; this article covers the analysis method that turns them into decisions. For how the same idea applies across a whole sequence of steps, see customer journey analytics, and for the web and app side specifically, digital experience analytics.
A useful working definition of "experience" comes from Meyer and Schwager (Harvard Business Review, 2007): the customer's internal, subjective response to any direct or indirect contact with the company. That is why one source cannot cover it. A page view is a contact, so is a chat, so is a delivery.
Which data sources do you need, and what does each tell you?
| Source | Question it answers | Blind spot | Typical fields |
|---|---|---|---|
| Behaviour (page views, events, paths) | Where do people go, stall or leave? | Cannot say why | Page, step, time, device, source |
| Frustration and error signals | Where is the page broken or confusing? | Only signals that can be detected on screen | Errors, repeated rapid clicks, exit page |
| Transactions | Who finished, and what was it worth? | Silent on people who gave up | Orders, value, returns |
| Survey scores (CSAT, NPS, CES) | How did they feel at a chosen moment? | Low response, skewed to the very happy or very unhappy | Score, comment, moment |
| Conversations (chat, email, tickets) | What exactly did they not understand? | Only people who wrote in | Transcript, start page, topic, resolution |
Rules for choosing sources:
- Start with behaviour and one conversation source. Almost every site has both, and together they answer "where" and "why".
- Add survey scores only for a defined moment. Ask after a purchase or after a chat is resolved, not on a generic pop-up.
- Keep one identifier across sources. If a conversation cannot be tied to the same visitor as the pageviews, you can only compare totals, not people.
| Source | Question it answers | Blind spot |
|---|---|---|
| Behaviour (page views, events, paths) | Where do people go, stall or leave? | Cannot say why |
| Frustration and error signals | Where is the page broken or confusing? | Only what can be detected on screen |
| Survey scores (CSAT, NPS, CES) | How did they feel at a chosen moment? | Low response; skews to extremes |
| Conversations (chat, email, tickets) | What exactly did they not understand? | Only people who wrote in |
Start with behaviour plus one conversation source; add survey scores only for a defined moment.
How do you run the analysis, step by step?
- Pick one journey and one outcome. For example "visitor reaches checkout and pays". A vague "improve experience" gives nothing to measure.
- Break the journey into 4 to 8 stages with a page or event that marks each one.
- Measure reach and drop between stages. Find the stage where the largest number of people leave, not the one with the lowest percentage. A 90% drop on a stage 20 people reach is smaller than a 30% drop on a stage 2,000 people reach.
- Look for frustration at that stage. Compare errors, repeated rapid clicks and exits there with the rest of the site. A stage that stands out on both drop and frustration is your suspect.
- Read the conversations and comments from that stage. Take 20 transcripts that began on that page and tag the reason for contact. Count the tags; do not just quote the most vivid one.
- Size the fix before you build it. Estimate how many more people would pass if the stage matched the one before it, and what they are worth.
- Re-measure after the change over a comparable period, and note any campaign or seasonal event that overlaps.
Worked example: a checkout that loses people at shipping
Sample data: 10,000 sessions in a month, with checkout stages marked by pages.
| Stage | Sessions | Reached from previous stage |
|---|---|---|
| Browsed (all sessions) | 10,000 | n/a |
| Cart | 3,000 | 3,000 ÷ 10,000 = 30.0% |
| Shipping step | 2,100 | 2,100 ÷ 3,000 = 70.0% |
| Payment step | 1,350 | 1,350 ÷ 2,100 = 64.3% |
| Order placed | 1,080 | 1,080 ÷ 1,350 = 80.0% |
Where. The largest loss in people is between the shipping step and the payment step: 2,100 − 1,350 = 750 sessions. That is a better lead than the 30% cart rate, because many browsers were never going to buy.
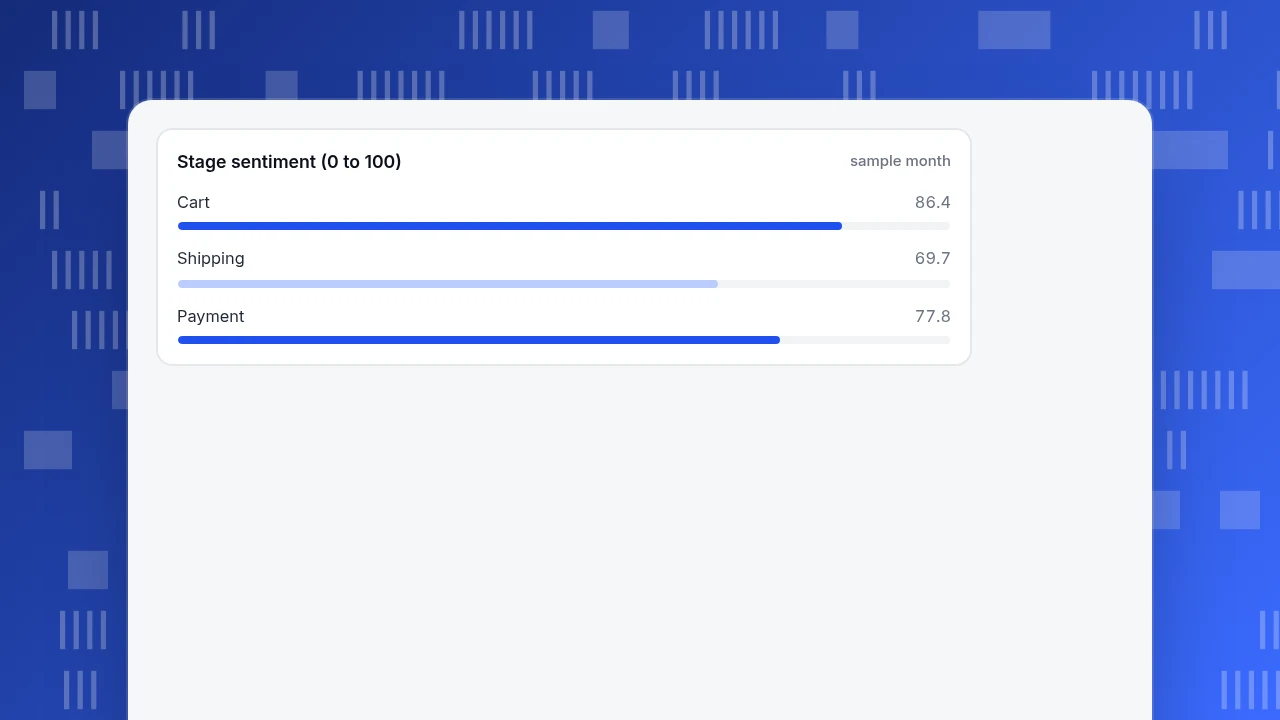
Frustration there. Using the same month, the shipping stage shows an error rate of 2.0%, 6.2% of sessions with repeated rapid clicks, and 36% of its sessions ending on that stage's pages. The cart stage (1.0%, 2.1%, 18%) and payment stage (3.5%, 3.0%, 25%) are calmer. Scoring each with the sentiment formula that a journey map uses, 100 − 1.5 × error − 1.5 × frustration − 0.5 × exit, gives shipping 100 − 3.0 − 9.3 − 18.0 = 69.7, cart 86.35 and payment 77.75. Shipping is the lowest.
Why. There were 420 chat conversations in the month. 180 of them started on the shipping page: 180 ÷ 420 = 42.9%, far more than the page's share of traffic. Tagging a sample of 20 of those transcripts showed the same question in 14 of them: "When will it arrive?" Their satisfaction scores averaged 3.4 out of 5, against 4.3 for chats that started elsewhere.
The fix and its size. Show an estimated delivery date in the cart, before the shipping step. If the shipping-to-payment rate rose from 64.3% to a hypothetical 72%, payment sessions would be 2,100 × 0.72 = 1,512, and orders at the same 80% would be 1,512 × 0.80 = 1,209.6, about 130 more than 1,080: a 12% increase. That is a forecast to test, not a promise, and the next month's numbers decide whether it held.
No single source found this. Behaviour located the stage, frustration confirmed it and conversations gave the reason.
Stage sentiment (0 to 100)
sample monthWhich survey metric belongs at which moment?
Survey scores earn their place when tied to a moment. Three are common.
| Metric | Question | Moment to ask | Source of the idea |
|---|---|---|---|
| CSAT | "How satisfied were you with this?" (usually 1 to 5) | Right after a support chat or a delivery | Common practice |
| CES | How much effort did it take to resolve your issue? | After a support interaction | Dixon, Freeman and Toman, HBR 2010 |
| NPS | "How likely are you to recommend us?" 0 to 10 | After the relationship has had time to form | Reichheld, HBR 2003 |
For NPS, Reichheld's method counts promoters (9 or 10) and detractors (0 to 6) and subtracts: NPS = % promoters − % detractors. If 50 of 100 respondents score 9 or 10 and 20 score 0 to 6, NPS = 50% − 20% = 30. The score is a summary; the comments next to it are where the "why" lives.
Do not ask all three at once. Match one question to one moment, and remember that the people who answer surveys are not a random sample of your customers.
What goes wrong in experience analytics?
- Averaging across moments. A 4.3 overall can hide a 3.4 at one stage. Score by stage.
- Reading only the loudest comments. Tag and count; the vivid complaint may be one in fifty.
- Treating low scores as the finding. The finding is the stage, the reason and the size.
- Comparing sources that cannot be joined. Totals can mislead when the people in the survey are not the people in the funnel.
- Measuring after a change with no comparison. Seasonality and campaigns move rates; compare like periods.
- Counting frustration where it was never measured. A stage with only events and no pages has no error or exit measure, so its sentiment looks high without meaning the experience was good.
How do you do this in TapCub?
Here is how the store above would find the shipping problem with TapCub. TapCub supplies the behaviour and conversation sides; it does not send NPS or CES surveys.
- Build the journey. In All-platform analytics › Business › Journey maps, add the stages in real order, with one page pattern or event per line. Pick the dates and read each stage's reach and the move to the next stage.
- Read the frustration column. Each stage shows error, frustration (rage clicks) and exit shares and a 0 to 100 sentiment. Stages made only of events have no page pattern, so those three read as zero and the sentiment looks high; give each stage a page pattern if you want the score to mean something.
- See what people do instead. In All-platform analytics › Behavior › Behavior analysis, run paths forward from the shipping step to see where people go next. Use Heatmaps and Session replay (off by default) on the shipping page if you need to see the clicks.
- Open the conversations that began there. Live chat › Reports lists the pages where chats started (top 10). In Live chat › Inbox, the agent sidebar shows the visitor's source, recent browsing and past conversations, with a link to the visitor profile in analytics, because analytics and chat use the same visitor ID.
- Compare satisfaction by moment. Live chat › Reports shows the 1 to 5 satisfaction score collected within 24 hours after a conversation is resolved. That is TapCub's only built-in satisfaction question; NPS and CES surveys, and text analysis of transcripts, are outside TapCub, so tag the reasons yourself.
FAQ
What is customer experience analytics?
It is the analysis of behaviour data, feedback scores and conversations together to find where the experience makes customers stall, struggle or leave. It ends in a ranked list of fixes with a size attached, not a dashboard of scores.
What data sources are used in customer experience analytics?
Behaviour (page views, events and paths), frustration and error signals, transactions, survey scores (CSAT, NPS, CES) and conversations (chat, email and tickets). Start with behaviour plus one conversation source, because they answer "where" and "why" together.
How is customer experience analytics different from customer experience metrics?
Metrics are the numbers (CSAT, NPS, CES, retention). Analytics is the method that lines those numbers up with behaviour and conversations, locates a stage and gives a reason. See customer experience metrics for the definitions of the scores.
How do you analyse customer feedback?
Pick the moment it was collected, tag each comment with a reason, count the tags and compare them with behaviour at that stage. In the sample, 14 of 20 transcripts from the shipping page asked about arrival time, which pointed to a specific fix.
Which customer experience metric should I start with?
Start with the metric tied to your biggest moment: CSAT after a support chat, CES after an issue is resolved or NPS after the relationship has had time to form. Pair it with behaviour for the same stage, since a score alone does not say where the problem is.
See also: How to Use Data to Improve Customer Experience: 6 Examples.
Sources
- Matthew Dixon, Karen Freeman & Nicholas Toman. Stop Trying to Delight Your Customers. Harvard Business Review, July–August 2010: the effort-based view of loyalty behind the Customer Effort Score. Verified 2026-11-19.
- Frederick F. Reichheld. The One Number You Need to Grow. Harvard Business Review, December 2003: the 0 to 10 recommendation question and the promoter minus detractor calculation. Verified 2026-11-19.
- Christopher Meyer & André Schwager. Understanding Customer Experience. Harvard Business Review, February 2007: customer experience as the response to direct and indirect contact with a company. Verified 2026-11-19.
Was this article helpful?
We use your answers to fix and expand this page.
Couldn’t send. Please try again in a minute.
Thanks for the feedback. We’ll use it to improve this page.You’ve already sent feedback on this page. Thanks.

Product Experience Specialist
Writes about product experience, practical workflows, and growth, turning complex processes into clear steps for everyday decisions.