Try it on your own data
Every report in this article is in the free plan. One snippet for web and apps, up to 10 sites.
Start freeThe customer journey stages most teams use are awareness, consideration, decision, retention and advocacy, and each needs its own metric because the customer is doing a different thing. One overall conversion rate mixes them. In the sample month below, 3.0% overall hid a 16.0% step from consideration to checkout where two extra points were worth 75 more orders.
What you will learn
- Give each stage its own metric; conversion rate belongs to the decision stage
- Write one entry rule per stage so two analysts get the same count
- Assign each person to the furthest stage reached in the last N days, counted once
What are the customer journey stages?
The customer journey stages most teams use are five: awareness, consideration, decision, retention and advocacy. Each answers a different customer question: "Does this exist?", "Is it right for me?", "Should I buy it, and from whom?", "Is it working for me?" and "Would I tell someone?" The names and the number vary by author; five is a convention, not a standard.
For something sturdier, Lemon and Verhoef (Journal of Marketing, 2016) describe three phases of the customer experience: pre-purchase, purchase and post-purchase. The five stages are a finer split of the same three phases: awareness and consideration before purchase, decision at purchase, retention and advocacy after.
The point of staging a journey is measurement. A single number, such as "conversion rate", mixes people who are at different stages and want different things. Staging lets you give each stage its own metric and its own owner. How to draw the stages on a visual map is covered in customer journey map; this article is about what to measure in each.
Which metric belongs to which stage?
The thesis of this article is that each stage needs a different metric, because the customer is doing a different thing.
| Stage | Customer's question | Behaviour you can observe | Stage metric | Metric that misleads here |
|---|---|---|---|---|
| Awareness | "Does this exist?" | A first visit from search, social, an ad or a referral | New visitors by source | Total pageviews |
| Consideration | "Is it right for me?" | Product, pricing or comparison pages; return visits; chat questions | Share of new visitors who view a product or pricing page | Time on site |
| Decision | "Should I buy, and from whom?" | Cart, checkout, payment steps | Checkout start rate; checkout completion rate | Overall conversion rate alone |
| Retention | "Is it working for me?" | Repeat visits, repeat orders, product use | Repeat purchase rate within 90 days; retention by cohort | New customer count |
| Advocacy | "Would I tell someone?" | Referral links, shares, reviews, recommendations | Share of customers who refer; referred visitors | Social follower count |
Two clarifications. First, conversion rate is a decision-stage metric, and using it to judge awareness is a mistake: a campaign built to be seen will convert low by design. Second, advocacy is measurable but often only by proxy. The best-known survey metric is Net Promoter Score (Reichheld, Harvard Business Review, 2003), which asks how likely a customer is to recommend you on a 0 to 10 scale; behaviour such as referral links used and reviews left says what people actually did.
| Stage | Customer's question | Stage metric | Metric that misleads here |
|---|---|---|---|
| Awareness | Does this exist? | New visitors by source | Total pageviews |
| Consideration | Is it right for me? | Share of new visitors who view a product or pricing page | Time on site |
| Decision | Should I buy, and from whom? | Checkout start and completion rates | Overall conversion rate alone |
| Retention | Is it working for me? | Repeat purchase within 90 days | New customer count |
| Advocacy | Would I tell someone? | Share of customers who refer | Social follower count |
Conversion rate belongs to the decision stage; judging awareness by it points effort the wrong way.
How do you decide who is in which stage?
A stage is only measurable if you can say which page or event puts a person in it. Write one rule per stage and keep it simple enough that two analysts reach the same count.
| Stage | Example entry rule (sample) | Where it comes from |
|---|---|---|
| Awareness | First session in the period | The first visit recorded for the person |
| Consideration | Viewed a product page or the pricing page | Page view on named paths |
| Decision | Started checkout | The checkout-start event |
| Retention | A second purchase within 90 days of the first | Order events |
| Advocacy | Shared a referral link, or left a review | A share event or a review event |
Test each rule with a quick count. If "viewed a product page" includes 95% of all visitors because the home page links to a product, the rule does not separate anyone and needs a stricter version, such as two product pages or a click on the price.
Worked example: five stages, one month
Sample data: a store tracks one month of new visitors through the stages.
| Stage | Measure | People | Rate vs the stage before |
|---|---|---|---|
| Awareness | New visitors | 20,000 | n/a |
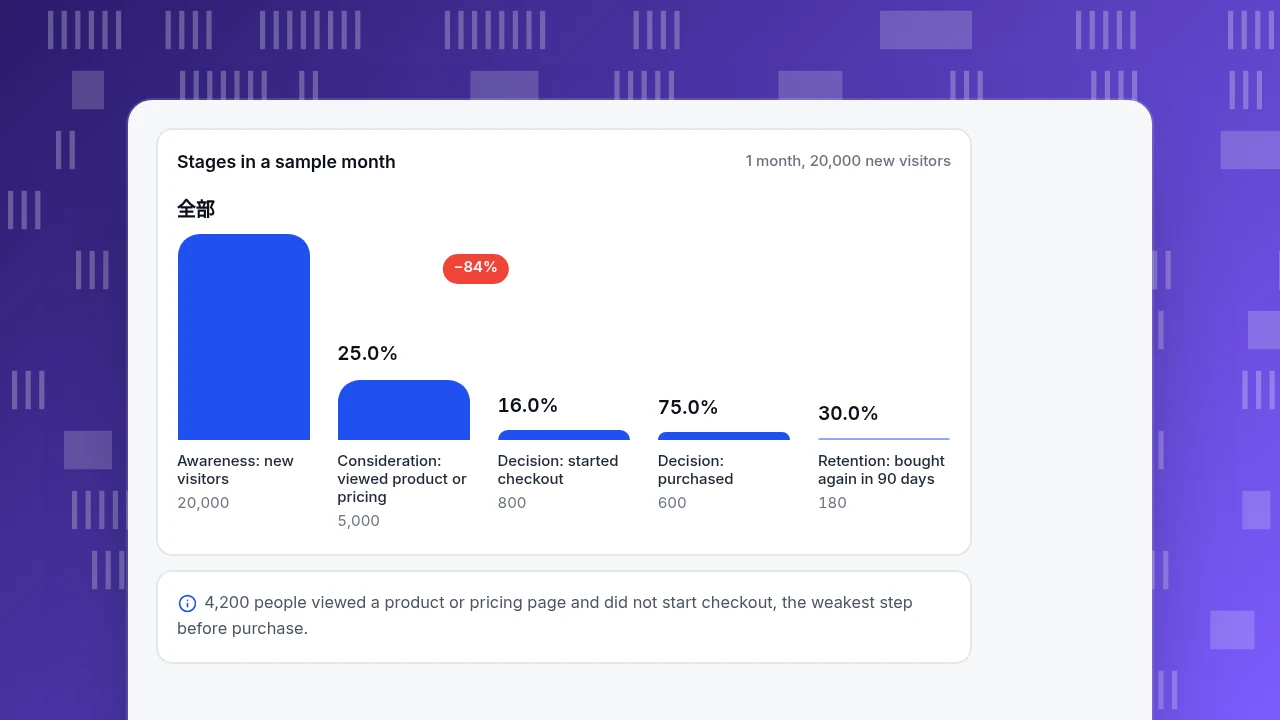
| Consideration | Viewed a product or pricing page | 5,000 | 5,000 ÷ 20,000 = 25.0% |
| Decision (start) | Started checkout | 800 | 800 ÷ 5,000 = 16.0% |
| Decision (finish) | Purchased | 600 | 600 ÷ 800 = 75.0% |
| Retention | Bought again within 90 days | 180 | 180 ÷ 600 = 30.0% |
| Advocacy | Shared a referral link or left a review | 48 | 48 ÷ 600 = 8.0% |
The overall conversion rate from visitor to buyer is 600 ÷ 20,000 = 3.0%. That one number hides the stage story. The store would not know whether to work on getting seen, on getting considered, on checkout or on bringing people back.
Where is the biggest opening? Compare the rates. Consideration to checkout start, at 16.0%, is the lowest conversion before purchase: 4,200 people looked at a product or pricing page and did not start checkout. Checkout completion at 75.0% is healthier.
What would an improvement be worth? Add the same two percentage points in two places and recompute orders.
- Raise consideration-to-checkout from 16.0% to 18.0%: 5,000 × 0.18 = 900 checkouts, × 0.75 = 675 orders, 75 more than 600 (+12.5%).
- Raise awareness-to-consideration from 25.0% to 27.0%: 20,000 × 0.27 = 5,400 considerers, × 0.16 = 864 checkouts, × 0.75 = 648 orders, 48 more than 600 (+8.0%).
The same two points are worth more where the rate is lower, because the gain is a bigger fraction of what you had. These are hypothetical gains to test, and an improvement at one stage often changes who reaches the next.
What about the later stages? 180 of 600 buyers coming back (30.0%) and 48 sharing (8.0%) are smaller numbers but each repeat or referred customer arrives without an acquisition cost. Track them as their own stages instead of folding them into acquisition.
Stages in a sample month
1 month, 20,000 new visitorsAwareness: new visitors
20,000
Consideration: viewed product or pricing
5,000
Decision: started checkout
800
Decision: purchased
600
Retention: bought again in 90 days
180
How do you handle people who don't move in order?
Customers do not travel strictly from stage one to five. A returning buyer goes back to consideration for a second product, a visitor may jump from awareness to decision and a business buyer may sit in consideration for months while several colleagues join in. Treat stages as states, not as a conveyor belt.
A rule that works for most analyses: assign each person to the furthest stage they reached in the last N days, and count them once. Choose N to match your buying cycle (for example 30 days for a low-priced product). Two consequences follow:
- A person who buys and returns is counted in retention, not in decision again, so the decision number stays honest.
- A person who disappears for longer than N days falls out of the stage, which gives you a way to see who has gone quiet.
Segment the same stages by customer type. A first-time buyer and a repeat buyer have different considerations, and one blended number hides both.
What do teams get wrong with journey stages?
- Using one metric for every stage. Conversion rate for awareness, or pageviews for decision, points effort in the wrong direction.
- Copying a sales funnel and calling it a journey. A funnel counts what the company does to acquire; a journey includes retention and advocacy. Edelman and Singer (HBR, 2015) argue for managing the journey across touchpoints rather than each step on its own.
- Stopping at purchase. The stages after purchase are where much of the value is, and they are the ones teams measure least.
- Treating stages as strictly sequential. Use the furthest-stage rule instead of assuming a straight line.
- Using stage names with no entry rule. "Consideration" means nothing until you write which page or event puts someone there.
- Comparing stage rates between very different audiences. Compare like with like: new vs returning, one channel vs another.
For a deeper dive on how stages play out in a software business, see SaaS customer journey; for the lifecycle view of the same people, customer lifecycle.
How do you track the stages in TapCub?
Here is how the store above would put its five stages into TapCub. TapCub measures behaviour on the site, app and chat; it does not send surveys, so a survey-based advocacy metric such as NPS has to come from another tool.
- Define the stages. In All-platform analytics › Business › Journey maps, add up to 20 stages in real order, each with one or more pages (a full path, or a prefix ending in
*) and events. Pick a date range and read each stage's reach. The reach rate is relative to the first stage, not the stage before, so compute stage-to-stage rates as in the table above. - Check the transitions. The journey map counts a move to the next stage only when the same session hits this stage first and the next stage later. For the decision stage, use a funnel in All-platform analytics › Behavior › Behavior analysis with the cart, checkout and purchase steps.
- Measure the later stages. In the same place, run Retention from the purchase event, and read the lifecycle view, which counts people as New, Returning, Resurrecting or Dormant (in the interface) each week or month.
- Look at advocacy. In All-platform analytics › Business › AARRR growth, the referral stage shows shares, sharers, referred new users and the share rate, based on a share event you configure. Referred new users are those whose channel is social or referral.
- Watch where people leave a stage. Use Paths on the same page to see what people do after a stage's last step, and Live chat › Reports to see which pages start chats.
FAQ
What are the 5 stages of the customer journey?
Awareness, consideration, decision, retention and advocacy. Each answers a different customer question and takes a different metric: new visitors for awareness, product-page views for consideration, checkout completion for decision, repeat purchases for retention and referrals for advocacy.
What are the 7 stages of the customer journey?
Some sources describe seven stages, usually a finer split of the same journey, but there is no single standard. Use as many stages as you can measure and act on. Each needs a clear entry rule, which matters more than the number.
How do you measure each stage of the customer journey?
Give each stage its own metric: new visitors by source, share who view a product or pricing page, checkout start and completion, repeat purchase within 90 days, and share of customers who refer. In the sample, those gave 25.0%, 16.0%, 75.0%, 30.0% and 8.0%.
Is the customer journey linear?
No. Customers can skip stages, repeat them or stay in one for months. Treat stages as states and assign each person to the furthest stage reached in the last N days, counted once.
What is the difference between a customer journey and a sales funnel?
A funnel counts what happens up to the sale from the company's point of view. A journey includes what the customer does before and after, including retention and advocacy, and treats the stages as states rather than a one-way sequence.
See also: User Journey Map: 3 Worked Examples Built From Real Path Data.
Sources
- Katherine N. Lemon & Peter C. Verhoef. Understanding Customer Experience Throughout the Customer Journey. Journal of Marketing 80(6), 2016: pre-purchase, purchase and post-purchase phases. Verified 2026-11-19 (the publisher blocks automated requests).
- David C. Edelman & Marc Singer. Competing on Customer Journeys. Harvard Business Review, November 2015: managing the journey across touchpoints. Verified 2026-11-19.
- Frederick F. Reichheld. The One Number You Need to Grow. Harvard Business Review, December 2003: the 0 to 10 recommendation question. Verified 2026-11-19.
Was this article helpful?
We use your answers to fix and expand this page.
Couldn’t send. Please try again in a minute.
Thanks for the feedback. We’ll use it to improve this page.You’ve already sent feedback on this page. Thanks.

Product Experience Specialist
Explores usability, user journeys, and feature adoption through practical examples of onboarding and everyday product use.