Try it on your own data
Every report in this article is in the free plan. One snippet for web and apps, up to 10 sites.
Start freeCustomer journey touchpoints are the contacts between a customer and your business before, during and after a purchase. List them by stage, say how each is measured, then compare how many people reach each one with how many go on to the outcome. In the sample month below, paid social brought 1,200 sessions at 1.0% against 3.4% overall, so it, not the checkout, was the first thing to examine.
What you will learn
- List touchpoints by stage and by who controls them, not by team or channel
- For each one, record how many people reach it and how many go on
- Gaps between people who used a touchpoint and people who did not are partly selection; use them to see where people stop, not to claim credit
What is a customer journey touchpoint?
A customer journey touchpoint is any contact between a customer and your business, before, during or after a purchase: an ad, a search result, a product page, a chat, a delivery, an invoice. The journey is the sequence of touchpoints one customer goes through; a touchpoint is one step in it. The shorter entry on touchpoint gives the definition; this article is about how to list them and decide which to work on.
Lemon and Verhoef (Journal of Marketing, 2016) divide touchpoints into four kinds by who controls them:
- Brand-owned: your website, ads, emails, store, packaging.
- Partner-owned: a marketplace, a reseller, a payment provider, a co-marketing partner.
- Customer-owned: the customer's own actions, such as comparing options or asking a colleague.
- Social or external: reviews, forums, friends, news and search results that you do not control.
The split matters because you can measure the first group well, the second partly, and the last two only indirectly. A touchpoint inventory that lists only your own channels is not a journey; it is a channel list.
Which touchpoints belong to which stage?
Group touchpoints by what the customer is trying to do. Lemon and Verhoef use three phases, before purchase, during purchase and after purchase, which are enough to start.
| Stage | Customer's task | Typical touchpoints | What you can measure |
|---|---|---|---|
| Before purchase | Find options and judge them | Search results, ads, social posts, reviews, a friend's advice, a comparison page | Sessions by source and campaign; landing pages; return visits |
| During purchase | Decide and pay | Product page, pricing page, live chat, demo request, cart, checkout, payment | Page views, steps reached, chats started, orders |
| After purchase | Get value, get help, return | Confirmation email, delivery, onboarding, support, invoice, renewal notice | Repeat visits, support contacts, repeat orders, retention |
Edelman and Singer (Harvard Business Review, 2015) argue that companies do better by managing the whole journey across touchpoints than by optimising each one in isolation. That is the reason to list touchpoints by stage rather than by team: the product page, the chat and the checkout are one customer's afternoon, even though three teams own them.
| First touchpoint (source) | Sessions | Orders | Conversion rate |
|---|---|---|---|
| Organic search | 2,200 | 66 | 3.0% |
| Paid social | 1,200 | 12 | 1.0% |
| 600 | 48 | 8.0% | |
| Direct | 700 | 35 | 5.0% |
| Referral | 300 | 9 | 3.0% |
Sample data: 5,000 sessions and 170 orders, 3.4% overall. Source is the entry source of each session, so earlier visits are not credited.
How do you take a touchpoint inventory, step by step?
- Pick one customer type and one outcome. For example "first-time buyer who orders online". Mixed audiences give a list nobody can act on.
- List what that customer can touch, by stage. Start from the table above and add yours. Ask a few real customers: "How did you first hear of us, and what did you look at before buying?"
- Mark who owns each touchpoint. Brand-owned, partner-owned, customer-owned or external. Note which ones you can measure.
- Say how each is measured. The data source, the field and the metric. A touchpoint with no way to measure it is marked as a gap rather than dropped.
- Count volume and outcome. For each measurable touchpoint, record how many customers reach it and how many go on to the outcome.
- Rank by size of the loss and by ease of fix. A touchpoint with high volume and low conversion is a candidate; a low-volume, high-conversion one is a candidate for more reach, carefully.
- Re-run quarterly. New channels appear, and old touchpoints stop mattering.
How is each touchpoint measured?
| Touchpoint | Where it appears in your data | Metric |
|---|---|---|
| Paid ad or social post | Source and campaign tags on the landing visit | Sessions, conversion rate, cost per order |
| Organic search | Search engine as the referring source | Sessions, landing pages, conversion rate |
| A tag on links in the email | Sessions from email, conversion rate | |
| Pricing or product page | Page views in the session | Share of sessions that view it; next step |
| Live chat | Conversations started, with the page they began on | Chat starts per 100 sessions; orders after chat |
| Support contact | Tickets or chats after purchase | Contacts per 100 orders; reasons |
| Offline or word of mouth | Not visible in web data | Ask "how did you hear about us?" at checkout |
Two rules help. Tag every link you control, so the source is in the data. And add one question at checkout for what you cannot see.
Worked example: where does a small store lose people?
Sample data: one month, 5,000 sessions and 170 orders, an overall rate of 170 ÷ 5,000 = 3.4%. Group sessions by the source of the visit.
| First touchpoint (source) | Sessions | Orders | Conversion rate | Sessions without an order |
|---|---|---|---|---|
| Organic search | 2,200 | 66 | 3.0% | 2,134 |
| Paid social | 1,200 | 12 | 1.0% | 1,188 |
| 600 | 48 | 8.0% | 552 | |
| Direct | 700 | 35 | 5.0% | 665 |
| Referral | 300 | 9 | 3.0% | 291 |
| Total | 5,000 | 170 | 3.4% | 4,830 |
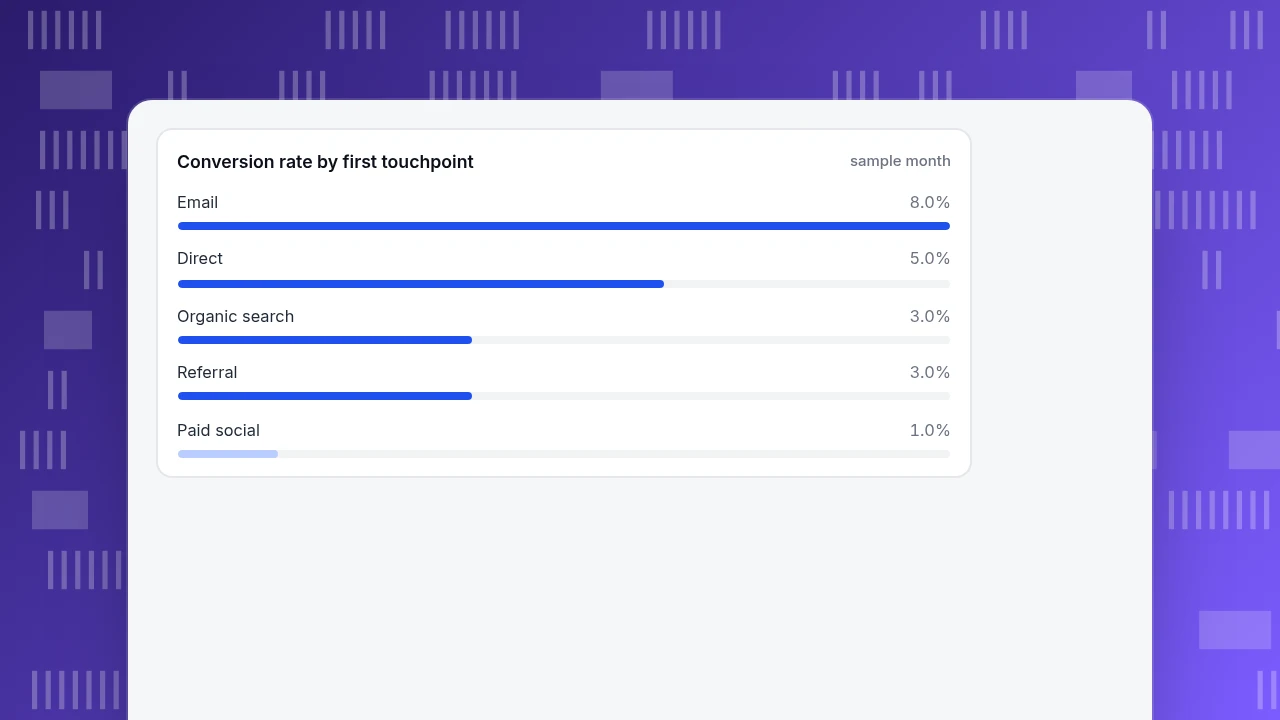
Sessions add to 5,000 and orders to 170. Two touchpoints stand out. Paid social brings 1,200 sessions at 1.0%, far below the 3.4% average, so it is the largest, weakest source: a fix or a cut. Email converts at 8.0% but brings only 600 sessions, so there is room to grow it, provided the list keeps its quality.
Now look inside the visit, at touchpoints in the middle of the journey.
- Pricing page. 1,500 sessions viewed it; 105 ordered, 105 ÷ 1,500 = 7.0%. The 3,500 that did not view it produced 65 orders, 65 ÷ 3,500 = 1.9%.
- Live chat. 250 sessions started a chat; 40 ordered, 40 ÷ 250 = 16.0%. The other 4,750 produced 130 orders, 130 ÷ 4,750 = 2.7%.
Take care here. These gaps do not say the pricing page or chat caused the orders. People who look at pricing or ask a question are already closer to buying, so the gap is partly selection. Use the figures to see where interested people go and where they stop, not to claim credit. A second warning: the source table gives each session's single entry source. A visitor who first met you through search, then came back through email, is counted under email. To spread credit across the sessions that came before an order, use multi-touch attribution.
The decision from this inventory: look at what paid social sends people to, since its landing pages are the first touchpoint those 1,200 sessions see; keep pricing and chat paths easy to find; and ask at checkout how people heard about the store to catch what the data does not show.
Conversion rate by first touchpoint
sample monthWhat mistakes make touchpoint inventories useless?
- Listing channels, not touchpoints. "Email" is a channel. "The order confirmation email" and "the abandoned-cart email" are touchpoints with different jobs.
- Only counting what you own. Reviews, forums and friends shape the decision; list them and, where you cannot measure, ask.
- Measuring volume without outcome. A touchpoint everyone sees tells you little unless you know what happens next.
- Using the entry source for everything. A single source per session hides the sessions before it. Use a multi-touch view for credit.
- Treating gaps as proof. People who use pricing pages or chat already lean toward buying.
- Optimising one touchpoint in isolation. A faster checkout does nothing if the pricing page sends people away first.
- Never refreshing the list. Re-run it each quarter.
For how touchpoints fit onto a full map, see customer journey map; for the analysis side, customer journey analytics.
How do you do this in TapCub?
Here is how the store above would build its touchpoint numbers in TapCub. TapCub measures what happens on your site, app and chat; offline touchpoints, email opens and surveys are outside it.
- Read the source touchpoints. In Web analytics › Sources, see visitors by channel, source and UTM parameters. Tag your email and ad links with UTM parameters so they show up under their own rows. Channel rules can be configured.
- See what people do next. In All-platform analytics › Behavior › Behavior analysis, run Paths forward from a landing page, or backward from the order, to see which pages came between. Each step keeps the most common pages and folds the rest into "other".
- Spread credit across touches. On the same page, use attribution with the order as the goal. The touch can be channel, source, UTM campaign or landing page; the look-back window defaults to 30 days; and you can select first, last, linear, position and time-decay together so each model is its own column. A channel that is high only under "linear" or "position" is a helper, not a closer.
- Check the chat touchpoint. Live chat › Reports shows the pages where chats started (top 10), and Live chat › Reports › Conversion attribution compares visitors who chatted with those who did not, with a warning under 30 chatters. That is the 16.0% vs 2.7% comparison in the example, with the same selection caveat.
- Put the stages in order. In All-platform analytics › Business › Journey maps, list stages with pages and events, and read each stage's reach and drop.
TapCub does not tell you about touchpoints that leave no trace on your site, so keep the checkout question.
FAQ
What are customer journey touchpoints?
They are the points of contact between a customer and your business before, during and after a purchase: ads, search results, product pages, chats, deliveries, invoices. List them by stage and measure how many customers reach each and how many go on.
What are examples of customer touchpoints?
Before purchase: a search result, an ad, a review. During: a product page, pricing page, chat and checkout. After: a confirmation email, delivery, support contact and renewal notice. Touchpoints can be brand-owned, partner-owned, customer-owned or external.
How do you identify customer touchpoints?
Pick one customer type and outcome, list what they can touch by stage, mark who owns each and how it is measured, then count how many reach it and convert. Ask a few real customers how they first heard of you and what they looked at.
How do you measure the effectiveness of a touchpoint?
Compare how many people reach it with how many go on to the outcome, as in the sample, where paid social converted 1.0% of 1,200 sessions against 3.4% overall. Beware of reading gaps as cause: people who view pricing or chat were already closer to buying.
How many touchpoints are there in a customer journey?
It varies by business, and any fixed number is a convention rather than a rule. Count the ones your customers actually go through, which an inventory by stage will show. Start with the ones that carry the most volume and add as you learn.
Sources
- Katherine N. Lemon & Peter C. Verhoef. Understanding Customer Experience Throughout the Customer Journey. Journal of Marketing 80(6), 2016: the four touchpoint types and the pre-purchase, purchase and post-purchase phases. Verified 2026-11-19 (the publisher blocks automated requests).
- David C. Edelman & Marc Singer. Competing on Customer Journeys. Harvard Business Review, November 2015: managing journeys across touchpoints. Verified 2026-11-19.
Was this article helpful?
We use your answers to fix and expand this page.
Couldn’t send. Please try again in a minute.
Thanks for the feedback. We’ll use it to improve this page.You’ve already sent feedback on this page. Thanks.

Product Experience Specialist
Explores usability, user journeys, and feature adoption through practical examples of onboarding and everyday product use.