Try it on your own data
Every report in this article is in the free plan. One snippet for web and apps, up to 10 sites.
Start freeA customer onboarding system has three blocks: guidance that tells the account what to do next, data that shows which milestones it has reached, and people who step in when it stalls. Analysis tells you which step accounts get stuck on; guidance and people are what you use to fix it.
What you will learn
- Three blocks: guidance, data, people; each fails without the others
- In the sample, 160 accounts finished setup but only 88 invited teammates (55.0%); those who invited were 75.0% active at day 30, those who did not, 8.3%
- Report time to value as a median (5.5 days) and a share within a window (60% in 7 days), not a mean (9.5 days)
What a customer onboarding system is
A customer onboarding system is everything that gets a new account from signing up to getting value: the guidance it sees, the data you track about its progress, and the people who step in when it stalls. It is a system because each part depends on the others. Guidance with no data cannot tell you what to fix. Data with no one to act on it is a report. People with no data end up emailing everyone. Retention is why it is worth the effort: Harvard Business Review credits Frederick Reichheld of Bain & Company with the finding that raising retention by 5% can raise profits by 25% to 95%, a figure that varies by business.
This page is about the B2B case, where a customer is an account with several users, a contract and often a person at your company responsible for them. If you are looking for the in-product experience of a single user, see onboarding flow, and for the numbers, onboarding metrics. Mobile specifics are in app onboarding.
The three blocks, side by side:
- Guidance tells the customer what to do next: setup steps, checklists, templates, help articles.
- Data shows where each account is: which milestones it has reached and how long that took.
- People handle what guidance cannot: a call, a setup session, an answer in a chat.
The table below lists the job of each block, what it needs and how it usually fails. The rest of the article builds each block in order and then shows a worked example with numbers you can recompute.
| Block | Its job | Needs | Fails when |
|---|---|---|---|
| Guidance | Tells the account what to do next | A short checklist of real outcomes; help beside the step | It is a long tour nobody finishes, or it is out of date |
| Data | Shows where each account is and how long it took | Milestones that are events, with a window and a date | It counts users, not accounts, or tour completion, not progress |
| People | Handle what guidance cannot | Written triggers, owners, a capacity check | They contact everyone, or nobody owns the stuck list |
The three blocks feed each other: stuck accounts point to guidance gaps, and chat questions show where to write help.
Block 1: guidance should appear when it is needed
The most common mistake is to start with a long tutorial. Nielsen Norman Group's research on onboarding says tutorials interrupt users, do not necessarily improve task performance and are quickly forgotten; it also notes that users want to start using a product right away, so they tend to skip them. Its recommended alternative is to show help when a signal says the user needs it, make it easy to dismiss and recall, and limit it to what is not obvious.
For a B2B product that means:
- Replace the tour with a checklist of real outcomes. "Connect your data" and "Invite a teammate" are outcomes. "Learn about the dashboard" is not.
- Put help next to the step. A one-line explanation beside the field that confuses people beats a video on a separate page.
- Keep the checklist short. Four or five items. If your product needs fifteen steps before value, the problem is the product's setup, not the checklist.
- Make every step skippable and recoverable. People who skip a step should be able to find it again.
Guidance is cheap to build and expensive to maintain, because every product change makes some of it wrong. Review it whenever the setup flow changes.
Block 2: data starts with milestones, not with page views
A milestone is a moment that shows the account has moved forward. The rule for choosing one is that it must be observable as an event and linked to staying. "Understood the product" is not observable. "Received the first event from the customer's site" is.
For an analytics-style product, a sensible list of five milestones looks like this:
| Milestone | Event that shows it | Why it matters |
|---|---|---|
| Account created | Contract or signup | Start of the clock |
| Setup finished | First data or first event received | Without data nothing else works |
| Team invited | Two or more users in the account | Shared use survives one person leaving |
| Core feature used | A saved report, a goal, a first dashboard | The thing they bought it for |
| Still active at day 30 | Any session in days 24 to 30 | The result that matters |
Test each milestone before you trust it: split accounts by whether they reached it, and compare how many are still active later. If reaching it makes no difference, it is not a milestone, however natural it feels. The next section shows what the comparison looks like.
Two cautions. First, reaching a milestone does not prove it caused retention, because stronger accounts may do both. Second, every milestone should have a window, such as "within 14 days of signing", so the comparison is fair across accounts of different ages.
A worked example: where accounts stall
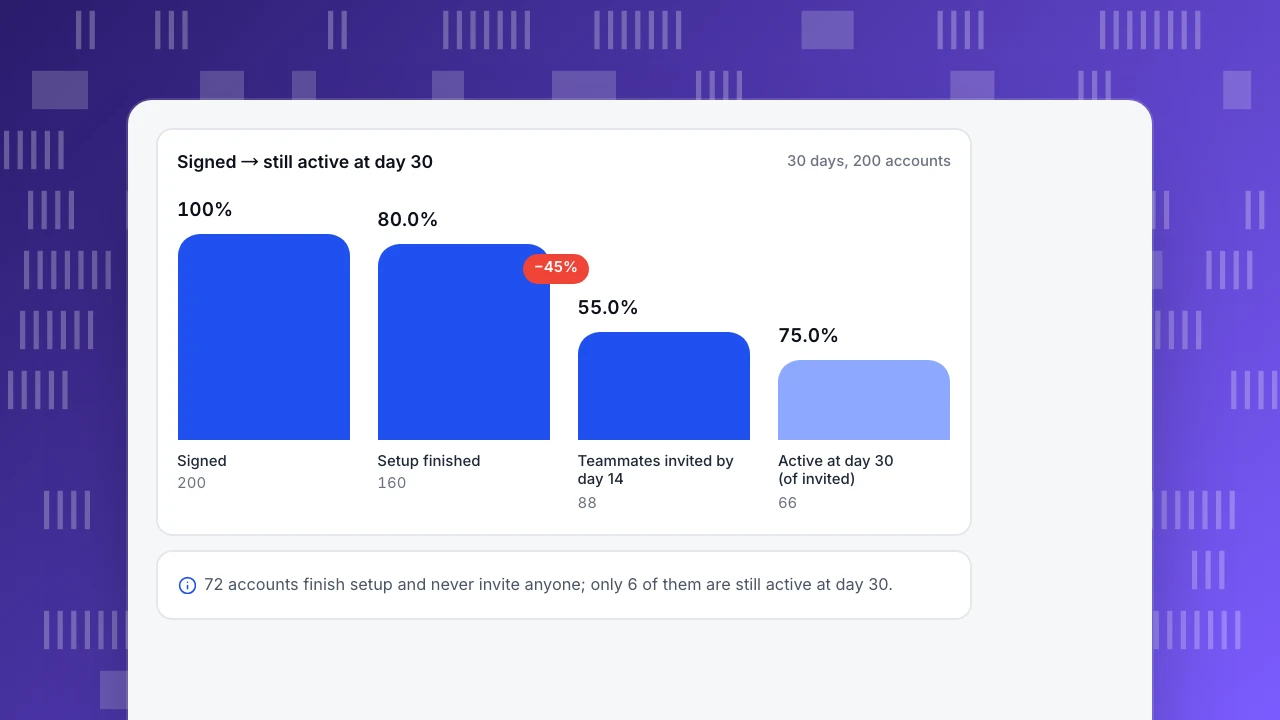
Sample data: a B2B analytics product signs 200 accounts in a quarter. Each account is followed for 30 days.
| Step | Accounts | Rate from previous step | Lost at this step |
|---|---|---|---|
| Signed | 200 | n/a | n/a |
| Setup finished | 160 | 80.0% | 40 |
| Teammates invited by day 14 | 88 | 55.0% | 72 |
| Active at day 30 (of those invited) | 66 | 75.0% | 22 |
Overall, 66 ÷ 200 = 33% of accounts completed the path. The weakest step is the invitation: 72 of the 160 accounts that finished setup never invited anyone, which is 45%.
Now test whether the invitation matters. Of the 160 accounts that finished setup, 88 invited teammates and 72 did not. Day-30 activity:
- Invited: 66 of 88 = 75.0%.
- Did not invite: 6 of 72 = 8.3%.
- All setup-finished accounts: 72 of 160 = 45.0%.
Six accounts that never invited anyone were still active at day 30, so the path is not the only way to stay. But the gap, 75.0% against 8.3%, is large enough to make the invitation step the first thing to work on. If a change moves the invitation rate from 55% to 70%, then 160 × 0.70 = 112 accounts invite, which is 24 more than today. At the sample's 75.0% rate, that is about 18 more active accounts, 24 × 0.75.
Two things this example does not show. It does not show whether the invitation caused the retention, since stronger accounts may do both, and it does not show what the effort costs. The first question to ask is what would make teammates easier to invite, which is a guidance question. The second is which of the 72 accounts are worth a human conversation, which is the third block.
Signed → still active at day 30
30 days, 200 accountsSigned
200
Setup finished
160
Teammates invited by day 14
88
Active at day 30 (of invited)
66
Time to value: report the median, not the mean
Time to value is how long it takes an account to reach the first milestone that matters. Averages mislead here because a few slow accounts drag them up.
Sample data: days from signing to first data received for ten accounts: 2, 3, 3, 4, 5, 6, 9, 12, 20, 31.
- Mean: 95 ÷ 10 = 9.5 days.
- Median: the middle pair is 5 and 6, so 5.5 days.
- Share finished within 7 days: 6 of 10 = 60%.
Report the median and the share within a target window. "60% of accounts get data flowing within 7 days" tells a team what to improve; "9.5 days on average" hides that most accounts are quick and a few are stuck. The stuck accounts are exactly the ones for block 3. For the related ratio, see activation rate.
Block 3: people step in on a rule, not on a feeling
People cost the most, so they should go where data says guidance is not enough. Write the triggers down so the team does not rely on memory.
Rules that work in practice:
- If setup is not finished by day 3, a person reaches out. In the example, 40 accounts never finished setup; that is a list a person can work in a week.
- If an account has one user at day 14, offer a setup session. The example shows 72 accounts at risk of this.
- If an account that was active goes quiet for 14 days, check in. A quiet account that paid is a better conversation than a lost one.
- If a question arrives in chat, answer it and note which step it came from. A repeated question is a gap in guidance, so feed it back to block 1.
A rough capacity check keeps the rules realistic. If one person can handle 12 accounts a week and rule 2 fires for 72 accounts, that is six weeks of work. Either change the rule to the highest-value accounts first, or fix the guidance so fewer accounts need it.
Run a weekly loop so the three blocks stay connected
The system works only if the blocks talk to each other. A weekly 20-minute review is enough:
- Open the milestone funnel for accounts that signed in the last 30 days. Which step lost the most accounts?
- Open the list of accounts that missed a trigger this week. Who owns each one?
- Read the questions that came in. Which ones should become guidance?
- Pick one change for the week, and write the number that will tell you if it worked.
Keep a short log of changes with dates. When the funnel moves, you want to know what changed that week.
Common mistakes with customer onboarding systems
- Measuring tour completion, not account progress. Finishing a tour says nothing about whether data is flowing.
- Counting users when the customer is an account. One enthusiastic user does not make an onboarded account; count accounts with two or more active users.
- Using averages for time to value. The median and a target window are clearer.
- Treating every account the same. Low-touch accounts need good guidance; high-value accounts need a person.
- No owner for stuck accounts. A list that nobody owns does not change anything.
- Changing several things at once. Then you cannot tell which change moved the funnel.
Measure this in TapCub
Take the example above and set it up in TapCub.
- Define the milestones as events. Send an event for each milestone with
tapcub.track, and record them in All-platform analytics › Data › Tracking plan, where each event has an owner, status and properties and the real-time check shows arrivals (create a tracking plan). - Build the funnel. In All-platform analytics › Behavior › Behavior analysis, add a funnel with the milestone events as steps and a window of 14 days. Each step shows its count, rate against the previous step and drop-off, and clicking a step shows who dropped there (build a funnel).
- Count accounts, not just users. When a user logs in, call
tapcub.group('company', 'acme', {...})so people are summed under their account. All-platform analytics › Users › Accounts shows account counts, members, 30-day active accounts and a health score from 0 to 100 (40 points for the share of members active in 30 days, 30 for days active, up to 30 for recent presence). In an analysis, the identity can be switched to account. That view is organizational: it cannot open personal details or take a segment, so switch back to people when you need to see who. - Check retention for the invited group. Create a retention report with the first event as start and any activity as return. Compare accounts or people with and without the invitation event (build a retention report).
- Meet people where they hesitate. If your product is a web app with the TapCub script installed, Live chat › Chat settings › Proactive invites can open a message on the setup page after a set number of seconds. In Live chat › Inbox, the agent sees the visitor's source, current page and recent browsing, with a link to their analytics profile.
TapCub measures onboarding; it does not build in-app tours or checklists, send onboarding emails or assign tasks. Use your own tools for those, then return to the funnel to see whether the step moved.
FAQ
What is a customer onboarding system?
It is the combination of guidance, data and people that takes a new customer from signup to first value. Guidance tells them what to do next, data shows which milestones each account has reached and how long that took, and people step in when an account stalls. Tools such as checklists and dashboards are parts of it.
What should a customer onboarding system track?
Track a handful of milestones that can be seen as events: account created, setup finished, team invited, core feature used and still active at day 30. For each, record the date, so you can measure time to value. Track at the account level in B2B, because one enthusiastic user does not make an onboarded customer.
How do you measure whether customer onboarding is working?
Compare the share of accounts reaching each milestone within a fixed window, the median time to value, and day-30 activity for accounts that did and did not reach each milestone. Check milestones by splitting accounts: a milestone that makes no difference to later activity is not worth building a process around.
How long should customer onboarding take?
It depends on the product, so set a target from your own data. Report the median days to the first milestone and the share finished within a window, such as 60% within 7 days in the sample. A long median can be fine for a complex product if most accounts finish; a long tail is the signal to watch.
When should a person step in during onboarding?
When the data shows guidance is not enough: setup not done by a set day, only one user after two weeks, or an active account that goes quiet. Write these as rules so they fire consistently, and check that your team can handle the volume they create.
See also: AI Onboarding: A Flow With AI Steps and Activation Before and After.
Sources
- Nielsen Norman Group, Onboarding Tutorials vs. Contextual Help (tutorials interrupt users and are quickly forgotten; use pull revelations; make help easy to dismiss and recall). Checked 2026-11-18.
- Harvard Business Review, The Value of Keeping the Right Customers (credits Reichheld of Bain & Company with the 5% retention and 25% to 95% profit finding). Checked 2026-11-18.
Was this article helpful?
We use your answers to fix and expand this page.
Couldn’t send. Please try again in a minute.
Thanks for the feedback. We’ll use it to improve this page.You’ve already sent feedback on this page. Thanks.

Product Analyst
Focuses on event analysis, conversion funnels, and retention, using clear metric definitions and structured analysis to explain product performance.