Try it on your own data
Every report in this article is in the free plan. One snippet for web and apps, up to 10 sites.
Start freeAn onboarding flow is the guided path from signup to a user's first real outcome. It ends when the user first gets value, not when they finish the tour, and every extra step must prove it gets more people to that moment. Here are the formats, design steps, a worked funnel example, and the metrics that show what to cut.
What you will learn
- End the flow at the first value event, not at tour completion: 90% tour completion can hide 25.2% activation
- Design backward from activation and defer every ask that can wait until after first value
- Cut the biggest pre-value drop, then verify with before/after cohorts — completion is not the metric
What is an onboarding flow (and where should it end)?
An onboarding flow is the guided path that takes a new user from signup — or first launch — to their first meaningful outcome in your product: the moment they connect their data, see their first report, or send their first message. It is the in-product part of the broader user onboarding process, which also includes welcome emails, documentation and sales calls; the first screens a new user meets are often called the first-time user experience. The outcome it aims at is usually called the aha moment, and the speed of reaching it is time to value.
The endpoint rule: an onboarding flow ends when the user first gets value, not when they finish the tour. The last screen of a welcome tour is not the finish line; the activation event is. If a user can reach that event without finishing your tour, the tour is longer than it needs to be.
Sample data makes the gap obvious. In one month, 1,000 new users signed up for a B2B analytics product; 900 of them (90.0%) finished the welcome tour. Only 252 (25.2%) reached first value — viewing a report built from their own data. A team celebrating 90% tour completion is measuring compliance. The 25.2% is the number that predicts whether those users come back.
The distinction matters because the two numbers answer different questions. Tour completion tells you whether people tolerated the introduction; activation tells you whether the introduction worked. A flow can have excellent completion and poor activation at the same time, which is exactly what the sample shows.
That is the thesis of this guide: every extra step in a flow must prove it gets more people to first value. The sections below show how to pick a format, design backward from that event, find the step to cut with a recomputable example, and verify the change with cohorts.
Pick a format: checklist, empty state, interactive tutorial, or email
Four formats cover most onboarding flows. The table after this section compares when to use each, what it costs, and which success metric belongs to it. Most products need one primary format plus a supporting one — not all four at once.
Choose with if-then rules:
- If setup has several independent tasks (connect data, choose a template, invite a teammate), use a checklist with honest progress. Let users finish tasks in any order and return later; a checklist that forces a fixed order is a tour in disguise.
- If the user lands on a screen with no data, use an empty state that teaches the one next action. Nielsen Norman Group's research on onboarding tutorials found that upfront tutorials interrupt users, get skipped and are quickly forgotten; contextual help shown at the moment of need works better.
- If the first task is complex and hard to explain in text (an editor, a query builder), use an interactive tutorial that teaches by doing. Apple's Human Interface Guidelines recommend making onboarding fast, fun and skippable, and teaching through interaction rather than a long manual.
- If value takes days to appear (a data import, a team rollout), use an email sequence triggered by in-product events — "your import finished" beats a fixed day-3 drip.
- If you are unsure, start with empty states plus a short checklist, and add a tutorial only where your funnel shows people stuck.
A concrete checklist for the analytics product above might read: connect a data source, choose a report template, view your first report. Three items, each one action, each tied to the activation event. Invite teammates is deliberately absent — it belongs after value, as the worked example shows.
Two rules apply to every format. Let users skip: NN/g's mobile-app onboarding analysis recommends skipping onboarding when possible, and Apple's guidelines say a skipped tour should not reappear. And keep secondary features out of the first run — progressive disclosure means showing advanced options only when the user asks for them.
App-specific patterns — permission priming, paywall placement, deferred signup — are covered in app onboarding.
| Format | When to use | Cost | Success metric |
|---|---|---|---|
| Checklist | Setup has several independent tasks users can finish in any order | Low to build; needs honest progress and a reason to finish | Checklist completion that leads to activation |
| Empty state | The user lands on a screen with no data yet; teach the one next action | Low; one screen, one action | First action taken from the empty state |
| Interactive tutorial | The first task is complex and hard to explain in text | High to build and maintain; breaks when the UI changes | Task completion inside the tutorial, not tour completion |
| Email sequence | Value takes days to appear (imports, team setup); re-engage drop-offs | Writing and sending; easy to ignore | Return visits that reach the activation event |
Pick one primary format and let the others support it. Every success metric is tied to activation, not to finishing the flow.
Design the flow backward from first value
Design starts at the end. Six steps, each with a decision rule:
- Define the activation event first. Name the one action that marks first value — "viewed a report built from their own data", not "finished the tour". Rule: if you cannot write it in one sentence, you are not ready to design screens. How to choose and define it is in activation rate.
- List the shortest path to it. Write every step a user must take to reach that event. Anything not on the path is a candidate for removal or deferral. Rule: a step that does not change what the user can do next does not belong before value.
- Put value before asks. Defer account creation, permissions, invites and upgrade prompts until after first value wherever possible. NN/g documents deferred account creation as a way to let users experience the product before committing. Rule: ask for the minimum that the next screen actually needs.
- Make every question change the next screen. A personalization question earns its place only if the answer routes the user somewhere different. Rule: if every answer leads to the same screen, delete the question. For example, "What do you want to track?" is worth asking only if the answer changes the templates you show next.
- One decision per screen. If a screen asks two things, split it or cut one. Rule: count the decisions; more than one means the screen is doing two jobs.
- Time the hints, offer Skip, show honest progress. Put tooltips at the moment of need, keep Skip visible, and let progress bars reflect real steps rather than marketing. Rule: if a hint appears before the user has a reason to care, move it.
The order matters: steps 1–2 decide what exists, steps 3–5 decide what survives, step 6 decides how it feels. Teams that start from ready-made screen templates usually end up with steps 3–5 violated — invites and upgrade prompts before value — because the template was designed forward from signup instead of backward from the activation event.
Worked example: a 5-step funnel and the step we cut
Sample data: one month, 1,000 new signups, a five-step flow for the same B2B analytics product. The activation event is viewing a first report built from the user's own data.
| Step | What the user does | Users completing | Step conversion |
|---|---|---|---|
| 1 | Create account | 1,000 | — |
| 2 | Connect a data source | 800 | 80.0% |
| 3 | Choose a report template | 560 | 70.0% |
| 4 | Invite teammates | 336 | 60.0% |
| 5 | View first report (activation) | 252 | 75.0% |
Activation rate: 252 ÷ 1,000 = 25.2%. Step conversion is each step's users divided by the previous step's: 800 ÷ 1,000 = 80.0%, 560 ÷ 800 = 70.0%, 336 ÷ 560 = 60.0%, 252 ÷ 336 = 75.0%.
The biggest drop is the invite step. 560 users chose a template; only 336 continued past "invite teammates" — a loss of 224 users, 40% of the step. It is also the step that sits before value: users who have not seen a single report are asked to invite colleagues to a product they have not experienced. By the endpoint rule, that ask is in the wrong place.
The cut: move the invite after first value. Not delete — invites still matter for team expansion — just defer them until the user has seen their own report. The flow becomes: create account → connect data → choose template → view report → invite teammates.
If your product genuinely needs the invite before value — a collaboration tool where the first report is built by a team — keep it, but make the ask optional and explain what the teammate will see. The rule is not "never invite early"; it is "an early ask must earn its place with data".
The projection. 560 users reached the template step. Assume the 75% rate observed at the final step holds once the invite gate is removed: 560 × 75% = 420 activations, or 420 ÷ 1,000 = 42.0%. That is +16.8 percentage points over 25.2%, a relative gain of 420 ÷ 252 − 1 = +66.7%. The assumption is conservative: it keeps the step rate at 75% instead of assuming that removing friction raises it, and it applies a rate measured on the 336 users who passed the invite step to all 560, including the 224 who previously dropped. Treat 420 as a projection to verify with the next cohort, not a result.
Retention says the endpoint is right. Of the 252 activated users, 126 were still active on day 7: 126 ÷ 252 = 50.0%. Of the 748 who signed up but never activated (1,000 − 252), 75 returned on day 7: 75 ÷ 748 = 10.0%. Users who reached first value came back five times as often. Finishing the tour did not predict that; reaching value did.
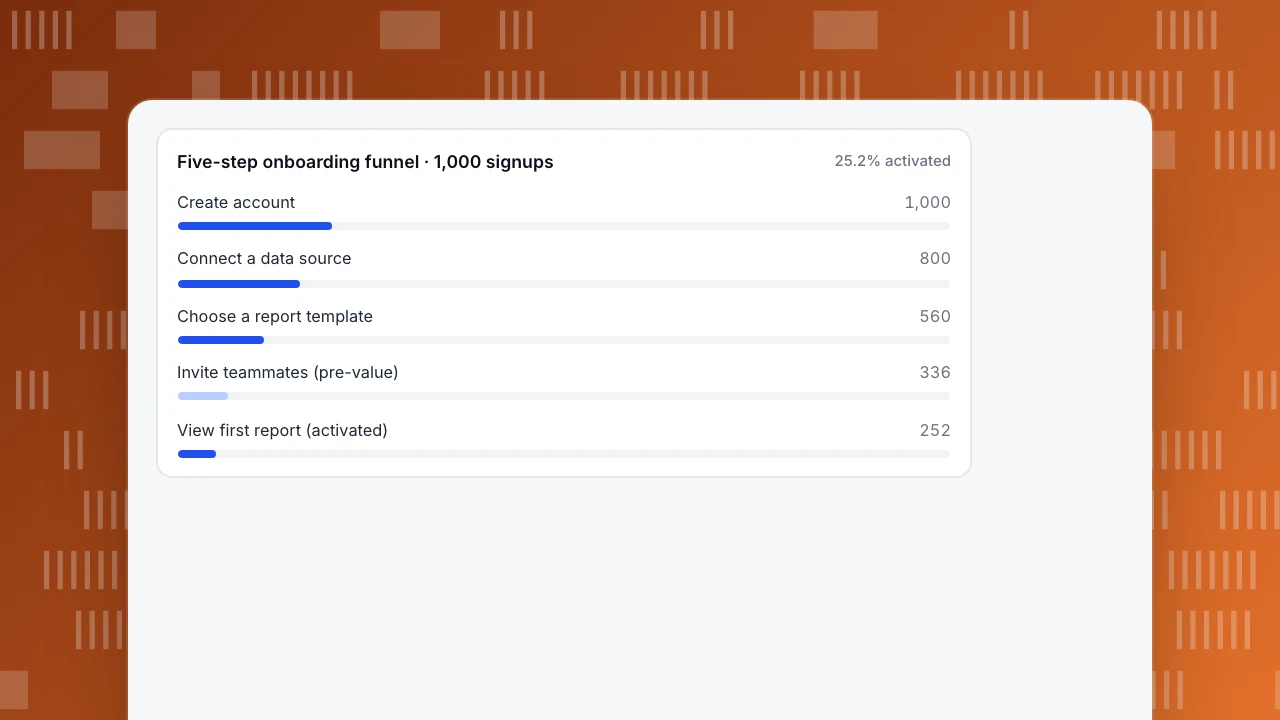
The chart after this section shows the same funnel as bars. The thesis holds in the arithmetic: the invite step was not getting more people to first value — it was stopping 224 of them — so it moved.
Five-step onboarding funnel · 1,000 signups
25.2% activatedOnboarding in a product-led (PLG) motion
In a product-led motion, the product itself is the main channel for acquisition, conversion and expansion. Onboarding carries more weight because there is no sales call to rescue a confused user. Three decision rules:
- Self-serve means the activation event is an in-product aha, not a demo. If your motion is self-serve, measure first value inside the product — a report viewed, a project created — not a scheduled walkthrough.
- Let users try before they commit. Where possible, let people experience value before creating an account; deferred account creation is one of the patterns NN/g documents. Gate only what you must, such as saving work. How to design that sign-up step itself is covered in signup flow.
- Invites and upgrade prompts come after value. Expansion is a consequence of value, not a gate to it. Ask for the invite once the user has something worth sharing.
Measure a PLG flow with the same funnel you would use for any motion: the activation event is in-product, so the funnel, not the sales pipeline, is the source of truth.
The two motions optimize different things:
| Decision | Product-led | Sales-led |
|---|---|---|
| Where first value happens | In the product, self-serve | In a demo or onboarding call |
| When signup is asked | Often after a trial of value | Before the demo |
| What onboarding optimizes | Time to first value | Scheduled handoffs and qualification |
After first value, the job shifts from activation to habit: the trigger–action–reward loop that brings users back is covered in the hook model. Onboarding's job is to get them to the first reward; the loop keeps them there.
Measure and iterate: completion is not the metric
Three formulas cover the decisions in this guide. All use the sample month above.
- Activation rate = activated users ÷ signups. 252 ÷ 1,000 = 25.2%. This is the flow's scoreboard.
- Step conversion = users at the next step ÷ users at the previous step. 336 ÷ 560 = 60.0% at the invite step. This locates the leak.
- Day-7 retention of activated users = activated users active on day 7 ÷ activated users. 126 ÷ 252 = 50.0%. This checks that the activation event predicts real usage.
The cut rule: if removing a step does not lower activation, remove it; if activation drops, the step was earning its place — put it back. Tour completion is a diagnostic, not a goal: a 90% completion rate with 25.2% activation means the tour is not the thing to celebrate.
Verify changes with before/after cohorts, and read them carefully:
- Compare cohorts that signed up before and after the change, keeping the activation event definition fixed.
- Watch channel mix and seasonality: a month with more paid traffic can move activation without any product change.
- The comparison is observational, not an experiment. It shows association; it does not prove the cut caused the lift.
- Keep cohorts large enough to read: a few dozen signups can swing activation by several points on noise alone.
For the full metric set — time to value, step drop-off, cohort curves — see onboarding metrics; building the funnel itself is covered in build a funnel. The endpoint stays the same through every iteration: the flow ends when the user first gets value, and every step you keep must prove it gets more people there.
How to run this in TapCub
The example above — five steps, one pre-value invite, a −224 drop — runs in TapCub on one set of events across web, app and mini-program. Here is the same workflow, step by step.
- Define the five events before launch. In All-platform analytics › Data › Tracking plan, record each event's name, platform, trigger, required properties and owner. New events that arrive without a definition land in All-platform analytics › Data › Event inbox, where you claim them into the plan. Turn on 24-hour live validation to see each event's arrival count and required-property completeness. Use the same event names in the web script and the app and mini-program SDKs, so all platforms feed one funnel.
- Build the five-step funnel. In All-platform analytics › Behavior › Behavior analysis, create the funnel from create-account to view-first-report and read each step's conversion. The invite step's 60.0% — 224 users lost — is the number to act on.
- Find where the drop-offs went. Path analysis in the same menu shows where users who left the invite step went next. When you need the why, All-platform analytics › Behavior › Heatmaps shows clicks and rage clicks on the invite screen, and All-platform analytics › Behavior › Session replay (off by default) shows the hesitation before the exit.
- Identify users and reuse the segment. Call
tapcub.loginwhen a user signs in; they appear in All-platform analytics › Users › People with a day-by-day behaviour timeline. In All-platform analytics › Users › Segments & tags, build a rule segment — "connected a data source but never viewed a report" — and carry the same segment into funnels and retention instead of rebuilding it each time. Anonymous visitors have no profile and do not enter segments, so identify users at login if you want the segment to cover them. - Verify with retention cohorts. Compare day-7 retention of activated users before and after the change, cohort against cohort. TapCub does not run A/B tests or feature flags: ship the change to everyone and compare cohorts, observationally. Bots are identified and counted separately by default (Web analytics › Bots), so they never inflate the denominators in your conversion rates.
FAQ
How long should an onboarding flow be?
There is no universal step count. Keep only the steps on the shortest path to first value. Chameleon's 2025 SaaS Product Benchmarks Report, cited in its onboarding flows guide, puts typical activation flows at 3–7 steps and high-completion tours at five or fewer — a vendor benchmark, useful as a starting point, not a target. Every extra step must prove it gets more people to first value.
What is the difference between an onboarding flow and an onboarding checklist?
The flow is the whole path from signup to first value; a checklist is one format for organizing multi-step setup inside that path. A flow can combine a checklist, empty states, tooltips and emails. The checklist organizes tasks; it does not define where the flow ends — the activation event does.
Should signup come before or after value?
After, where possible. Let users experience something useful before creating an account — deferred account creation, documented by Nielsen Norman Group, is one way to do it. Ask for signup, permissions and invites once the first useful outcome exists, and gate only what you must, such as saving work.
What is a good activation rate?
There is no universal benchmark; it depends on how you define activation and who your users are. Define the event first, then compare your own cohorts over time. In the sample above, one cut moved activation from 25.2% to a projected 42.0%. The full metric set is in onboarding metrics.
Do I need A/B testing to improve onboarding?
Not to start. Ship the change to everyone and compare before/after cohorts on activation and day-7 retention. The comparison is observational, so watch channel mix and seasonality. TapCub measures funnels, paths and retention but does not run A/B tests or feature flags — the cohort method above is how you verify without them.
See also: Customer onboarding system: guidance, data and people, and how to measure it.
See also: What is a product tour? Types, metrics and how to judge one.
See also: User Onboarding: Reach the Aha Moment Sooner, and Prove It With Data.
Sources
- Nielsen Norman Group. Mobile-App Onboarding: An Analysis of Components and Techniques. Published 2020-06-21, updated 2021-01-24. Verified 2026-11-15.
- Nielsen Norman Group. Onboarding Tutorials vs. Contextual Help. Published 2023-02-12, updated 2024-02-13. Verified 2026-11-15.
- Nielsen Norman Group. Progressive Disclosure. Published 2006-12-03, updated 2022-07-15. Verified 2026-11-15.
- Apple. Onboarding — Human Interface Guidelines. Verified 2026-11-15.
- McConnell, K. Onboarding Flows: Design, Build, and Measure. Chameleon, 2026-06-01, updated 2026-11-11; length benchmark from Chameleon's 2025 SaaS Product Benchmarks Report (vendor data). Verified 2026-11-15.
Was this article helpful?
We use your answers to fix and expand this page.
Couldn’t send. Please try again in a minute.
Thanks for the feedback. We’ll use it to improve this page.You’ve already sent feedback on this page. Thanks.

Product Adoption Consultant
Explores customer onboarding, live conversations, and self-service, turning common usage questions into practical guidance and improvements.