Try it on your own data
Every report in this article is in the free plan. One snippet for web and apps, up to 10 sites.
Start freeUser onboarding exists to get new users to their first moment of real value, the aha moment, quickly, and its success is measured by activation rate. This guide shows how to find that moment from retention data instead of opinion, how to read an onboarding funnel and fix the step that loses most people, and which onboarding methods interrupt users least.
What you will learn
- Judge every onboarding step by one question: does it get more people to the aha moment, sooner?
- Find the aha moment by testing candidate actions against day-7 retention; common actions often barely separate returners
- Fix the biggest fixable funnel loss, then compare the next cohort rather than the same one
What is user onboarding, and what is it for?
User onboarding is everything that happens between a person signing up and the moment they first get real value from your product. Its job is narrow: get as many new users as possible to that first moment of value, quickly. That moment is often called the aha moment, and the share of new users who reach it is the activation rate. The time it takes is time to value.
Everything else about onboarding (tours, checklists, emails, welcome screens) is a means to that end. A tour that users enjoy but that does not move activation is decoration. So the test for any onboarding step is one question: does it get more people to the aha moment, sooner?
Two terms are worth keeping apart. Onboarding flow is the sequence of screens and prompts; it is covered in onboarding flow and the sign-up step before it in signup flow. Onboarding metrics are how you judge it, covered in onboarding metrics. This guide connects the two: find the aha moment from data, measure the path to it, and change the step that loses the most people.
How do you find the aha moment from your own data?
Do not guess the aha moment; test candidates. Pick actions new users can take in their first days, and compare how many of the people who did each action came back, against those who did not. Sample data for 1,000 new users, with day-7 retention overall of 21.1% (211 users):
| Candidate action | Users who did it | Retained among them | Retained among the rest | Gap |
|---|---|---|---|---|
| Completed profile | 700 | 152 (21.7%) | 59 of 300 (19.7%) | 2.0 points |
| Watched intro video | 380 | 85 (22.4%) | 126 of 620 (20.3%) | 2.0 points |
| Created first project within 3 days | 560 | 190 (33.9%) | 21 of 440 (4.8%) | 29.2 points |
| Created a project and invited a teammate within 7 days | 310 | 149 (48.1%) | 62 of 690 (9.0%) | 39.1 points |
The first two actions are common but barely separate returning users from the rest (a 2-point gap). The last two separate them sharply. The strongest candidate becomes your working definition of activation: creating a project and inviting a teammate within 7 days.
Two cautions. First, this is correlation: people who were already keen may do both. It tells you which action to guide people toward and test, not that the action causes retention. Second, check the sample: if only 30 people did an action, its retention figure will swing a lot.
| Method | Best for | Risk |
|---|---|---|
| Empty state with template | Products that need content to make sense | Template that does not fit the user |
| Checklist | A short list of steps toward activation | Too long, or steps that skip the aha moment |
| Contextual tip | A feature that confuses at one place | Shown to people who already know |
| Product tour at launch | Genuinely unfamiliar interfaces | Skipped and forgotten |
| Email sequence | Bringing back users who stopped | Sent to users who already activated |
| Human setup call | High-value, complex accounts | Does not scale |
Help at the moment of need tends to work better than a launch walkthrough, according to NN/G.
What does an onboarding funnel look like, and what do you fix first?
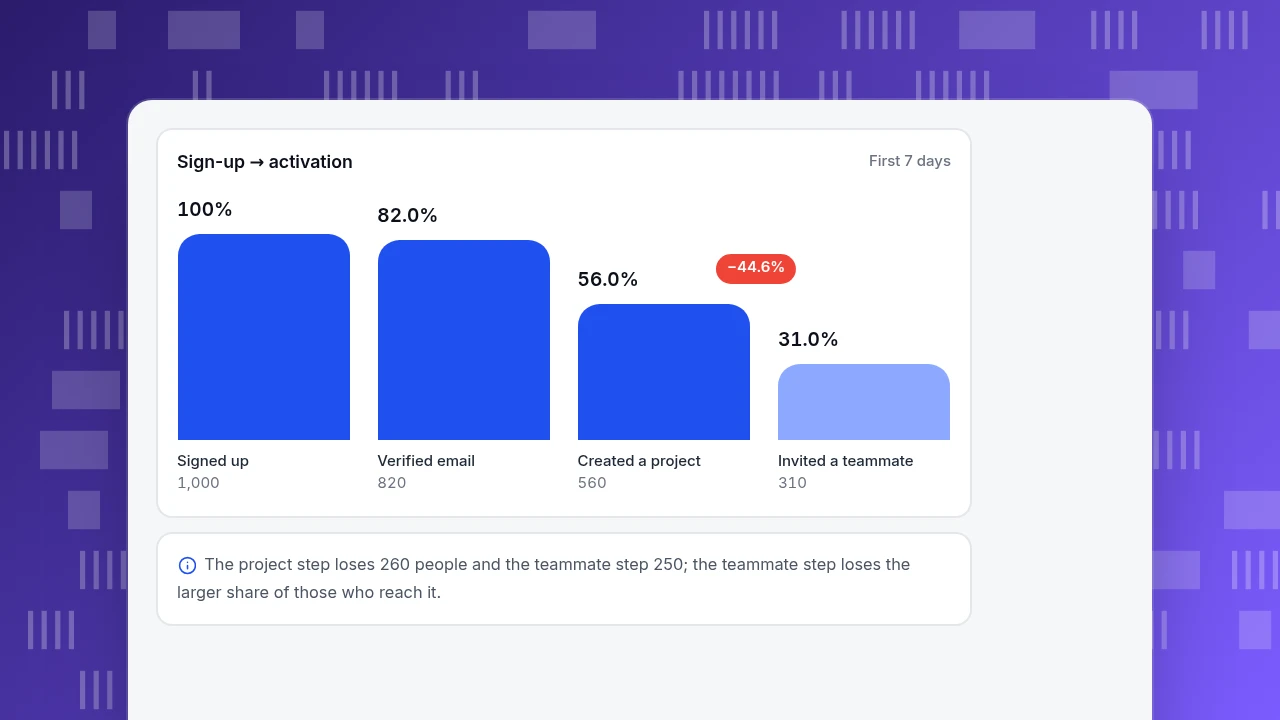
Using the activation definition above, here is the funnel for the same 1,000 sign-ups:
| Step | Users | Of previous step | Of all sign-ups | Lost at this step |
|---|---|---|---|---|
| Signed up | 1,000 | 100% | ||
| Verified email | 820 | 82.0% | 82.0% | 180 |
| Created first project | 560 | 68.3% | 56.0% | 260 |
| Invited a teammate | 310 | 55.4% | 31.0% | 250 |
Activation is 310 ÷ 1,000 = 31%. The two biggest losses are the project step (260 people, 31.7% of those who verified) and the teammate step (250 people, 44.6% of those who created a project). Fix the step with the biggest, most fixable loss; the teammate step is a large share of those who get there, and inviting is a decision a prompt can help with.
Suppose you add an in-product checklist with a ready-made template and a prompt to invite a teammate once the first project exists. Sample data after the change: 1,000 sign-ups, 820 verified, 640 created a project (78.0% of verified), 400 invited a teammate (62.5% of those). Activation rises from 31% to 40%, a 9-point or 29% relative gain.
What might that be worth? If the new activators kept the 48.1% day-7 retention of the old ones and everyone else kept 9.0%, retained users would go from 211 to 400 × 48.1% + 600 × 9.0% = 192 + 54 = 246, about 17% more. That assumption is generous, because the extra people the checklist converts are probably less keen than those who activated unaided, so treat 246 as an upper bound and confirm with real retention a week later.
Sign-up → activation
First 7 daysSigned up
1,000
Verified email
820
Created a project
560
Invited a teammate
310
Which onboarding methods work, and when?
The methods differ in how much they interrupt the user. Nielsen Norman Group's analysis of onboarding tutorials found that walkthroughs shown at launch are often skipped, dismissed and quickly forgotten, and that help shown at the moment of need, which it calls "pull" help, works better. Use that as the guide for choosing:
| Method | Best for | Risk |
|---|---|---|
| Empty state with a template or example | Products that need content before they make sense | Template that does not match the user's case |
| Checklist | A short list of steps toward activation | Too long, or steps that do not lead to the aha moment |
| Contextual tip (tooltip, inline hint) | A feature that confuses people at one specific place | Showing it to people who already know |
| Product tour at launch | Genuinely unfamiliar interfaces | Skipped and forgotten; adds a step |
| Email sequence | Bringing back users who stopped | Sent to users who already activated |
| Human setup call | High-value accounts with complex setup | Does not scale; cost per account |
A good rule is to show less before the aha moment and more help at the point where users stall. Keep help easy to dismiss and easy to find again, and use progressive disclosure so details appear on request. See also the NN/G note on progressive disclosure.
How do you improve onboarding step by step?
- Define activation as one specific, measurable behaviour inside a time window (for example: project created and teammate invited within 7 days), chosen from retention data as above.
- Build the funnel from sign-up to that behaviour, with each step an event you already track. Find the step with the biggest loss.
- Remove steps before the aha moment. Every field and screen before value costs users. Defer profile questions until after activation.
- Add help where people stall, not at the start: an empty-state template, a prompt after the first project.
- Follow up on the stuck. Send users who verified but did not create a project a short message on day 2 with one next step.
- Re-measure activation and day-7 retention for the next cohort and compare with the previous one, not with the same cohort.
One practical note on timing: pick the activation window before you look at results. A 7-day window suits a product people use weekly; a product used monthly needs a longer one. Changing the window after the fact to make a cohort look better is the quickest way to fool yourself.
What are the most common onboarding mistakes?
- Optimising completion of the tour. Tour completion is a vanity metric; activation is the outcome.
- Choosing the aha moment by opinion. Test candidates against retention.
- Asking for too much up front. Long profile forms before any value.
- One flow for everyone. A solo user and a team admin need different first steps.
- Judging by a single cohort. Compare cohorts side by side; one week can be unusual.
- Treating correlation as cause. Guide people to the action, then check whether retention follows for the new group.
- Never checking drop-off by step. Without it you will redesign the wrong screen.
How to measure onboarding in TapCub
Use the sample product above. TapCub measures what users do in your product and site; it does not build tours, checklists or in-app messages, so the guidance itself is built in your own product or email tool. The measurement steps:
- Track the steps as events. Make sure sign-up, email verification, project created and teammate invited are events sent from the product. A server-side call can send them; the tracking plan in All-platform analytics › Data › Tracking plan is a good place to record them.
- Build the funnel. In All-platform analytics › Behavior › Behavior analysis, add the four steps. The window defaults to 7 days (up to 180). The result shows the count at each step, the rate against the previous step and against step one, the drop-off and the median time from the previous step, which is your time to value in practice. Click the step with the largest drop to see the people who arrived or dropped there.
- Set the activation event. In the AARRR tab of the business settings (the AARRR report is at All-platform analytics › Business › AARRR growth), map activation to "created a project and invited a teammate" rather than a page view. Activation starts empty until you set it.
- Check that activation predicts return. In the retention report, choose sign-up as the start event and any return event, and compare cohorts. The size-weighted average appears under the table; in the sample that is how you would see 48% versus 9%.
- Follow individuals. Where users are identified with
tapcub.login, open All-platform analytics › Users › People to see the person's day-by-day behaviour timeline, which shows where a stuck user stopped. - Know the boundary. TapCub does not show tours or checklists, send onboarding emails or test variants. It tells you whether the changes you make elsewhere moved activation.
FAQ
What is user onboarding?
It is the process of guiding new users from sign-up to the first moment they get real value from a product. Its main measure is the activation rate: the share of new users who reach that moment within a set time.
What are the 5 stages of user onboarding?
Sources define them differently, so there is no standard list. A practical sequence is sign-up, verification or setup, first key action, activation (the aha moment) and early habit. Define the stages from your own funnel and measure the drop between them.
What is a good user activation rate?
There is no universal figure; it depends on the product and how activation is defined. Use your own previous cohorts as the baseline: in the sample here activation moved from 31% to 40% after one change, and the useful question is whether the next cohort beats the last.
How long should onboarding take?
As short as it can be while still reaching the aha moment. Measure the median time between funnel steps and cut the steps that do not move people toward activation. Long profile forms before first value are the usual culprit.
How do you measure the success of onboarding?
Track activation rate, time to value (median time to the activation step), step-by-step drop-off and day-7 retention for each sign-up cohort. Compare cohorts, and confirm the activation action predicts people coming back.
See also: User Activation Rate: How to Define, Measure and Improve It.
Sources
- Nielsen Norman Group. Onboarding Tutorials vs. Contextual Help. Launch walkthroughs are often skipped and forgotten; help at the moment of need works better.
- Nielsen Norman Group. Progressive Disclosure. Defer advanced detail until the user asks for it.
Was this article helpful?
We use your answers to fix and expand this page.
Couldn’t send. Please try again in a minute.
Thanks for the feedback. We’ll use it to improve this page.You’ve already sent feedback on this page. Thanks.

Product Experience Specialist
Explores usability, user journeys, and feature adoption through practical examples of onboarding and everyday product use.