Try it on your own data
Every report in this article is in the free plan. One snippet for web and apps, up to 10 sites.
Start freeUser retention strategies work best when matched to the user's stage: activation in days 0 to 7, habit in days 8 to 30, and dormancy and win-back from day 31. In a sample cohort of 1,000, the early stage lost 700 people and the mature stage lost 30. Below: what to do at each stage, and which to fix first.
What you will learn
- Split the first three months into early, growth and mature stages and give each its own metric
- In the sample, five points of improvement is worth +25 survivors early, +12.5 in the growth stage and +9 when mature
- Fix the earliest leak you can measure first; early changes can be read in about two weeks, mature ones take a quarter
What is user retention, and which strategy comes first?
User retention is the share of a group of users who are still active after a given time. You pick a starting event (signed up, first purchase), a return event (any activity, or a specific action) and a period, then count unique people. Mixpanel's documentation describes it the same way: a retention measurement pairs a first event with a later return event and counts unique users, not event totals. The result is a rate per period for each cohort; see retention metrics for the formulas and churn rate vs retention rate for the other side of the coin.
Which strategy to use depends on how long the user has been around, because the reason people leave changes with tenure. This guide splits the first three months into three stages:
| Stage | User age | The question | The job |
|---|---|---|---|
| Early | Days 0 to 7 | Did they reach value at all? | Activation |
| Growth | Days 8 to 30 | Is it becoming a habit? | Build the routine |
| Mature | Day 31 onwards | Do they still need it? | Protect and win back |
The answer to "which one first?" comes out of the numbers in the worked example below, and it is usually the early stage: it has the most users to lose, and it gives you an answer fastest. A user who never got value in the first week is not helped by a loyalty email in month three.
Harvard Business Review reported in 2014 that acquiring a new customer can cost anywhere from five to 25 times more than keeping an existing one, depending on the study and industry. The multiple varies a lot, so treat it as a reason to measure retention, not as a number for your own business case.
What do the three stages look like in data?
Sample data: a cohort of 1,000 people who signed up in the same week.
| Point in time | Still active | Share of cohort | Lost since the previous point |
|---|---|---|---|
| Signup | 1,000 | 100% | n/a |
| Day 1 | 450 | 45% | 550 |
| Day 7 | 300 | 30% | 150 |
| Day 30 | 180 | 18% | 120 |
| Day 90 | 150 | 15% | 30 |
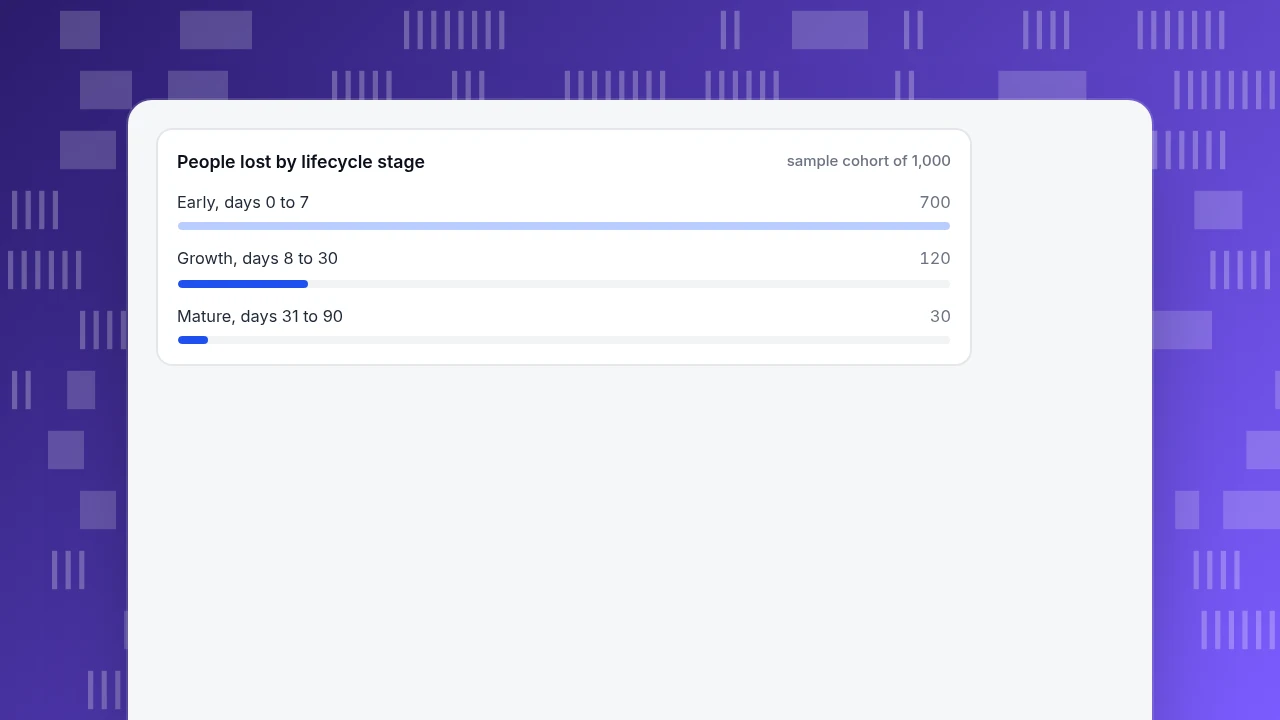
Group the losses by stage. In the early stage the cohort goes from 1,000 to 300, losing 700 people (70% of the cohort). In the growth stage it goes from 300 to 180, losing 120 (40% of the people who entered the stage). In the mature stage it goes from 180 to 150, losing 30 (16.7%). A retention curve that is steep at the start and flat at the end is normal; this one flattens around day 30, which is a sign that the people who reach day 30 mostly stay. The term for the shape is retention curve.
Read the steepness, not just the level. If the curve is still falling steeply at the end of the first week, you have an early-stage problem. If it is flat early but falls between weeks two and four, you have a habit problem. If it holds until day 30 and then drifts down slowly, you have a long-tail problem, which is the mature stage. For what the level should be, see good retention rate; it depends on how often people naturally need your product.
| Point in time | Still active | Lost since the previous point |
|---|---|---|
| Signup | 1,000 | n/a |
| Day 1 | 450 (45%) | 550 |
| Day 7 | 300 (30%) | 150 |
| Day 30 | 180 (18%) | 120 |
| Day 90 | 150 (15%) | 30 |
Sample cohort of 1,000 people who signed up in the same week.
What works in the early stage, days 0 to 7?
The goal is one thing: get the user to the first action that shows them the product works. People rarely leave in week one because the product is bad; they leave because they never saw it work. Strategies, with the number each should move:
| Strategy | What it looks like | Measure |
|---|---|---|
| Shorten the path to first value | Remove signup fields; skip steps that can wait; start in a useful state | Time from signup to the first key action |
| Define the activation action and push people to it | One checklist, one prompt, one empty state that points at it | Activation rate: activated ÷ signups |
| Follow up on people who stalled | A message that names the step they did not finish | Share of stalled users who later activate |
| Fix the technical drop-offs | Errors, slow pages and broken flows in the first session | Errors per session for new users |
| Ask what they came for | A single question at signup that sets up their first screen | Activation rate by answer |
In the sample, 45% of the cohort was active on day 1 and 30% on day 7. Both numbers belong to this stage. Because they are measured within a week, you can run a change and read the result in about two weeks. Keep the activation action specific: "created a first project" is measurable; "explored the product" is not.
What works in the growth stage, days 8 to 30?
Now the users have seen value once. The job is to make coming back a routine. People return when something brings them back and when there is something to do. Strategies:
| Strategy | What it looks like | Measure |
|---|---|---|
| Tie reminders to the user's own work | "Your draft is waiting", "Your report is ready", not generic news | Return rate within 48 hours of the reminder |
| Deepen use | Point users at the second and third features that people who stay use | Share of users with 2 or more features by day 14 |
| Compare cohorts by source and segment | Find which acquisition sources and user types fall off here | Day-30 retention by source |
| Add a reason to return with others | Invites, shared workspaces, comments, in products where it fits | Share of users who invited someone |
| Measure frequency, not only return | Days active per week, not just a yes or no | Stickiness: active days in the period |
In the sample, the cohort falls from 300 at day 7 to 180 at day 30, a loss of 40% of the people who entered the stage. A cohort comparison would show whether the loss is even or whether one source or one segment accounts for most of it. If the loss is concentrated, the fix is for those users, not for everyone.
What works in the mature stage, day 31 onwards?
The people left have a habit. The risks are different now: slow drift, a changed need, or a competing option. The job is to notice who is going quiet and to bring back those who have gone. Strategies:
| Strategy | What it looks like | Measure |
|---|---|---|
| Watch dormancy early | A flag on users inactive for 14 or 30 days | Dormant users per period |
| Win back with a reason | A message tied to something new or unfinished, not "we miss you" | Resurrected users ÷ dormant users contacted |
| Protect the best-fit users | Identify the segment with the longest tenure and make sure they are not neglected | Retention for that segment |
| Collect the reason for leaving | A short question or a conversation with lost users | Count of reasons by type |
| For business products, watch the account | Whether several people at one customer are still active | Active accounts, active members per account |
Sample data: a week's lifecycle counts for a product with a long-tenured base: 400 new, 1,200 returning, 150 resurrecting (active again after a gap) and 300 dormant (active this week, gone next week). Active people this week are 400 + 1,200 + 150 = 1,750. The net change is 400 + 150 − 300 = +250. The ratio of people gained to people lost is (400 + 150) ÷ 300 = 1.83. If that ratio falls toward 1.0, the product is replacing leavers instead of growing.
Which stage should you fix first? A worked example
Take the cohort above and ask what a five-point improvement in each stage is worth. Improvements are measured as a share of the people who enter a stage. The day-90 count is the cohort's survivors, currently 150.
| Stage | Survival now | Survival after +5 points | Day-90 survivors | Gain |
|---|---|---|---|---|
| Early (day 0 to 7) | 30% (300 of 1,000) | 35% | 175.0 | +25.0 |
| Growth (day 8 to 30) | 60% (180 of 300) | 65% | 162.5 | +12.5 |
| Mature (day 31 to 90) | 83.3% (150 of 180) | 88.3% | 159.0 | +9.0 |
The same five points are worth 25 survivors in the early stage, 12.5 in the growth stage and 9 in the mature stage, because the early stage applies to all 1,000 people and the later ones to the smaller group that remains. If you improve each stage by the same share, for instance 10% relative, all three give the same result (+15 survivors), since the stages multiply. So the order should not come from the arithmetic alone. It should also come from how quickly you can read a result:
| Stage | When the first cohort can be read |
|---|---|
| Early | After 7 days, plus a week of data to compare |
| Growth | After 30 days |
| Mature | After 90 days or more |
Early changes can be tested every two weeks; mature changes take a quarter. Fix the earliest leak you can measure first, then work forward. The gains in the table are not a promise: five points is an assumption, and a real change should be tested, with the result checked against the cohort rather than assumed.
People lost by lifecycle stage
sample cohort of 1,000What mistakes make retention strategies fail?
- Discounting for everyone. A blanket discount spends money on people who would have stayed. Target the stalled or dormant segment instead.
- Counting resurrected users as retained. People who came back after a gap are a win, but they are not the same as people who never left. Keep the two counts apart.
- Averaging cohorts. An average over six months hides whether recent cohorts are better or worse. Compare cohort by cohort.
- Comparing retention across products with different natural frequency. An invoicing tool is needed monthly, a messaging app daily. A fair comparison uses a period that fits the product.
- Treating retention as only a marketing job. Day-7 retention is mostly decided by the product and the first-session experience.
- Reading an unfinished period as a loss. The newest period is incomplete, not zero; see good retention rate for how to read it.
How to see retention by stage in TapCub
Here is how the sample cohort is read in TapCub.
- Run retention for the cohort. In All-platform analytics › Behavior › Behavior analysis, choose retention. Set the start event to "signed up", the return event to any activity, the period to day, and 30 days. Each row is a cohort with its size and a count and rate per period; a period that has not finished is empty, not zero, and the line under the table is the size-weighted average rate. For apps, App analytics › Users › Retention has a retention view.
- Find the stage with the steepest drop. Compare the rates at days 1, 7 and 30 against the table above. The mode "returned on period N or any later period" gives a curve that does not rise again; the exact-period mode shows people returning on that specific day.
- Read the four lifecycle states. The lifecycle view shows, per week or month, New, Returning, Resurrecting and Dormant people. Dormant is drawn on the next period as a negative, and the unfinished current period is not counted as dormant. That gives you the mature-stage numbers in the sample.
- Build the group to contact. In All-platform analytics › Users › Segments & tags, create a segment such as "inactive for 14 days", or, if you track purchases, use the RFM groups, which include "at risk" and "cannot lose". Segments can be used in other analyses too.
- Check the effect. Add the date of the change in Configuration › Annotations, then read the next cohort against the previous one.
TapCub does not send emails, push messages or discounts, and it does not run experiments. It tells you which stage leaks and which people to reach; the message itself and the delivery happen in your own tools.
FAQ
What are effective user retention strategies?
It depends on the stage. In the first week, shorten the path to the first useful action. In weeks two to four, tie reminders to the user's own work and deepen use. After the first month, watch for dormancy and win back with a specific reason. Measure each stage with its own metric and test changes one at a time.
How do you improve user retention?
Find where the cohort curve falls steepest, then fix that stage. Early drop-off is usually activation, mid-stage drop-off is habit, and late drift is dormancy. Compare cohorts by source and segment to see whether the loss is concentrated. Change one thing at a time and check the next cohort.
What is a good user retention rate?
There is no single figure; it depends on how often people naturally need your product. A daily-use app and a monthly-use tool should not be compared. A better test is whether your curve flattens and whether newer cohorts are retaining better than older ones.
Why is user retention important?
Retention determines whether acquired users turn into lasting value. Harvard Business Review reported that winning a new customer can cost five to 25 times more than keeping one, depending on the study and industry. Even without a multiple, a leaky cohort makes every acquisition channel look worse than it is.
How do you measure user retention?
Choose a starting event and a return event, group users by when they started, and count the share still active in each later period. Compare cohorts rather than averaging them, and treat the current unfinished period as incomplete. Mixpanel and Amplitude document the same first-event, return-event approach.
See also: How to Increase Monthly Active Users: Tactics by Lever.
Sources
- Mixpanel. Retention, product documentation. A retention behavior pairs a first event with a return event and counts unique users. Checked 2026-11-19.
- Amplitude. Build a retention analysis, product documentation. Retention measured from a starting event to a return event. Checked 2026-11-19.
- Amy Gallo. The Value of Keeping the Right Customers, Harvard Business Review, 29 October 2014. Cost of acquiring versus keeping customers. Checked 2026-11-19.
Was this article helpful?
We use your answers to fix and expand this page.
Couldn’t send. Please try again in a minute.
Thanks for the feedback. We’ll use it to improve this page.You’ve already sent feedback on this page. Thanks.

Product Adoption Consultant
Explores customer onboarding, live conversations, and self-service, turning common usage questions into practical guidance and improvements.