Try it on your own data
Every report in this article is in the free plan. One snippet for web and apps, up to 10 sites.
Start freeUX testing is watching or measuring real people attempting real tasks with a product, so you learn where it works and where it fails. Methods differ on three axes: moderated or unmoderated, qualitative or quantitative, in person or remote. Behaviour data shows where people struggle and testing shows why. This guide gives the method for each question, a sample-size table (five users find about 84% of problems) and a checkout example from drop-off to fix.
What you will learn
- Choose the method from the question: behaviour data for where, moderated sessions for why, unmoderated tests to measure
- Five participants per user group find about 84.4% of problems; measuring task success needs more, and 28 of 40 is 70% ± 14.2 points
- Run rounds of five and fix between them: in the sample, guest checkout (4 of 5) and shipping cost (3 of 5) explained a 48.0% drop at shipping
What is UX testing?
UX testing is watching or measuring real people trying to do real tasks with a product, so you learn where it works and where it fails. It is also called usability testing or user testing, and the three terms are often used for the same thing. Nielsen Norman Group describes a usability test as having three parts: a facilitator who guides the participant, tasks that are realistic activities the participant might do in real life, and a participant who is a realistic user or someone with a similar background or needs.
The point is to replace opinions with observation. A team can argue for an hour about whether a button is clear; five people failing to find it ends the argument. This guide is about choosing the method, the number of people, and what to do with the result, and about the fact that testing and behaviour data answer different questions: data shows where people struggle; testing shows why.
What kinds of UX testing are there?
Methods differ on three axes, and you choose a position on each:
| Axis | Option 1 | Option 2 | Choose by |
|---|---|---|---|
| Moderated or not | Moderated: a facilitator interacts live, in person or by screen share | Unmoderated: participants do written tasks alone, you review recordings and metrics | Need to ask follow-ups (moderated) or need many participants cheaply (unmoderated) |
| Qualitative or quantitative | Qualitative: insights about how people use it; best for finding problems | Quantitative: metrics such as task success and time on task; best for benchmarks | Finding problems or measuring them |
| In person or remote | In person: richer observation of context | Remote: faster recruiting, participants in their own setting | Reach and realism |
The definitions of qualitative and quantitative, and of moderated and unmoderated, follow Nielsen Norman Group's usability testing guide. A typical first study is moderated, qualitative, remote: five people, one hour each, screen shared, thinking aloud.
Which method fits which question?
Pick the method from the question, not from what the tool offers:
| Your question | Best-fit method | What you get |
|---|---|---|
| Where do people drop off? | Behaviour data: funnels, replays, heatmaps | Location of the problem, no reason |
| Why do they get stuck? | Moderated qualitative session | The reason, in their words |
| Does the new design perform better? | Unmoderated quantitative task test | Task success, time on task |
| Can people find X? | First-click or navigation test | Where they click first |
| What do people think before they buy? | Interviews | Context and motivation |
| Does it work on a phone? | Remote moderated or unmoderated on a real device | Mobile-specific problems |
For a mobile-specific plan, see mobile app usability testing; for how analytics and testing fit together, UX analytics; for a review of the interface by an expert rather than by users, UX audit.
| Your question | Best-fit method | What you get |
|---|---|---|
| Where do people drop off? | Funnels, replays, heatmaps | Location, no reason |
| Why do they get stuck? | Moderated qualitative session | The reason, in their words |
| Does the new design perform better? | Unmoderated quantitative task test | Task success, time on task |
| Can people find X? | First-click or navigation test | Where they click first |
Pick the method from the question, not from what the tool offers.
How many participants do you need?
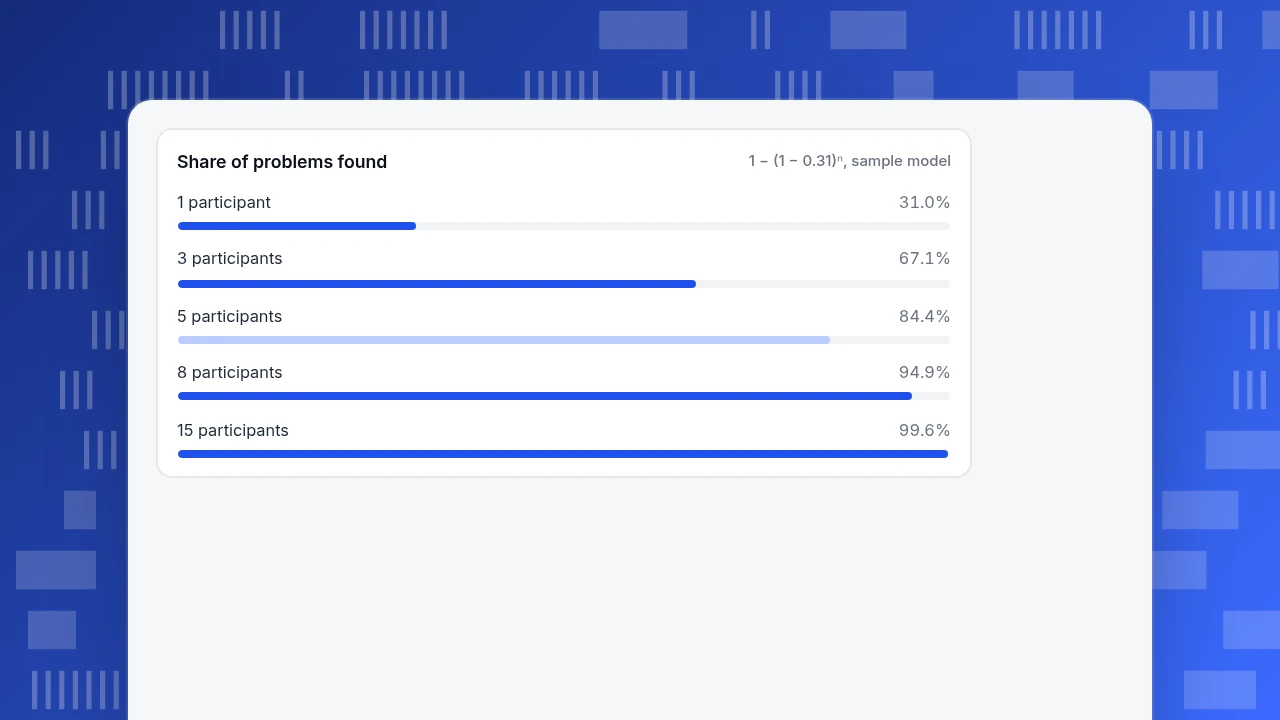
It depends on whether you want to find problems or measure them. For finding problems, the model from Nielsen and Landauer gives the share of problems found with n users as 1 − (1 − L)ⁿ, where L is the share of problems a single user uncovers; across their projects the typical value of L is 31%. Computed:
| Participants | Share of problems found (L = 0.31) |
|---|---|
| 1 | 31.0% |
| 3 | 67.1% |
| 5 | 84.4% |
| 8 | 94.9% |
| 15 | 99.6% |
Five users found about 85% of problems in their first study, which matches 84.4% in the formula. The curve flattens: going from five to fifteen adds about 15 points while tripling the cost, and the same problems repeat. The guide therefore recommends splitting the budget into several small studies of five, fixing problems between rounds, instead of one large study. This applies to a single user group; if you have distinct groups with different needs, test each group.
Measuring is different. If you want a task success rate you can trust, five people are far too few. With the simple 95% interval formula (1.96 × √(p(1 − p) ÷ n)), 4 of 5 successes (80%) already spans roughly 45% to 100%, and the formula itself is unreliable at that size, whereas 28 of 40 (70%) gives 70% ± 14.2 points, about 56% to 84%.
Share of problems found
1 − (1 − 0.31)ⁿ, sample modelWorked example: where it fails, why, and did the fix work?
Sample data. The behaviour data for a checkout shows:
| Step | Sessions | Continued | Continue rate |
|---|---|---|---|
| Cart | 1,000 | 700 | 70.0% |
| Shipping | 700 | 364 | 52.0% |
| Payment | 364 | 300 | 82.4% |
The biggest drop is at the shipping step: 700 arrive, only 364 continue, 48.0% leave. That is where; it says nothing about why.
Moderated sessions. Five participants attempt "buy this item". Sample findings: 4 of 5 could not find the guest-checkout option; 3 of 5 were surprised by the shipping cost appearing only at this step; 1 of 5 stalled at a coupon field. The fix list is ordered by how many people hit each problem: guest checkout (4), shipping cost (3), coupon (1). No analytics chart would have told you the first two.
Unmoderated check after the fix. 40 participants attempt the same task before the fix and 40 after: before, 21 of 40 completed (52.5%, interval 37.0% to 68.0%); after, 33 of 40 (82.5%, interval 70.7% to 94.3%). The intervals do not overlap, so the improvement is unlikely to be chance, although with 40 people per group the range is still wide. Then watch the live funnel: if the shipping-step continue rate rises from 52.0% towards the tested rate, the loop has closed.
Notice the order: data → moderated test → fix → unmoderated check → data again. Each method does the job it is best at.
How do you run a moderated session?
- Write tasks, not instructions. "You need a gift for a friend who likes cycling; buy something under $50" rather than "click Shop, then Cycling".
- Ask participants to think aloud, and stay quiet. Prompts such as "what are you looking for?" are fine; "do you see the button on the right?" is leading.
- Do not help. If they fail, note where and why; end the task after a set time.
- Record with permission, and take notes of exact words.
- Rank by frequency and severity. How many people hit it, and did it stop the task?
- Test after changes. Five new people, same tasks.
A session guide of five to seven tasks fits in an hour with time for questions.
What goes wrong in unmoderated tests?
Participants cannot be asked follow-ups, so the design carries the weight. Common problems: unclear task wording, participants rushing for a reward, and participants who are not your users. Keep tasks short and specific, include a screening question and an attention check, and review a sample of recordings, not only the success numbers. Report success with its interval, as above, so a small sample does not look like a measurement.
How do you combine testing with behaviour data?
| Question | Behaviour data tells you | Testing tells you |
|---|---|---|
| Where is the problem? | Funnel drop-off, rage clicks, error pages | |
| Why does it happen? | A hint (e.g. clicks on a non-link) | The cause, in the participant's words |
| How big is it? | Share of sessions affected | A small sample cannot say |
| Did the fix work? | Funnel rate after launch | Success rate in a follow-up test |
Use behaviour data to choose what to test and to size the problem; use testing to explain it; return to behaviour data to confirm the fix at scale.
Which mistakes weaken UX tests?
- Testing with colleagues. They know too much.
- Leading questions and helping. The result then reflects the facilitator.
- Treating five people as a measurement. It finds problems; it does not size them.
- One big test instead of rounds. You pay for repeated findings.
- No decision attached. Decide in advance what result would change the design.
- Reporting opinions instead of observations. "They didn't like it" is weaker than "4 of 5 could not find guest checkout."
How to combine behaviour data with testing in TapCub
TapCub supplies the where and the did it work; it does not recruit participants, run moderated sessions or deliver tests. Using the checkout example:
- Find the drop. In All-platform analytics › Behavior › Behavior analysis, build a funnel cart → shipping → payment → purchase. Each step shows the rate against the previous step, the median time and the largest drop; click a step to see who dropped there.
- See the clicks. All-platform analytics › Behavior › Heatmaps has Clicks, Rage clicks, Scroll reach and Elements tabs (autocapture must be on, which needs the Pro plan or higher). A rage click is three clicks within 300 milliseconds and 50 pixels, which often marks a control that looks clickable but is not.
- Watch a session. All-platform analytics › Behavior › Session replay shows one session. It is off by default, an admin or owner turns it on after confirming privacy settings, and input masking stays on; the sample rate starts at 10%. Use it to check whether real visitors hit the same problems you saw in the lab.
- Check errors and speed. Monitoring › Errors lists error groups with affected sessions, and Monitoring › Performance shows real-user page performance, so a "confusing" step is not just a slow or failing one.
- Annotate the fix and re-read the funnel. Add a date annotation under Configuration › Annotations on the day the checkout change ships, and compare the funnel for equal windows before and after.
- Ask visitors. Live chat › Inbox shows what the visitor was looking at when they wrote in, and a conversation can reveal a problem tests missed. TapCub does not run NPS or CES surveys.
FAQ
What is UX testing?
Observing or measuring real people attempting realistic tasks with a product to find where it works and where it fails. It is also called usability testing or user testing. A test has a facilitator, tasks and participants.
What is the difference between moderated and unmoderated UX testing?
In a moderated test a facilitator interacts live with the participant, in person or over screen share; in an unmoderated test the participant completes written tasks alone and you review recordings and metrics afterwards. Moderated lets you ask why; unmoderated reaches more people cheaply.
How many participants do I need for UX testing?
Five per user group is enough to find most common problems in a qualitative study: the formula 1 − 0.69ⁿ gives 84.4% at five users. For measuring task success you need more; 28 of 40 successes is 70% ± 14.2 points.
What are the main types of UX testing?
Moderated or unmoderated, qualitative or quantitative, in person or remote, plus method families such as first-click tests, interviews and benchmarks. Pick by the question you need answered.
How do you combine UX testing with analytics?
Use behaviour data to find where people drop and how many are affected, testing to learn why, and behaviour data again to confirm the fix. In the example, the funnel flagged a 48.0% drop at shipping, testing explained it, and a follow-up test showed success rising from 52.5% to 82.5%.
Sources
- Nielsen Norman Group. Usability Testing 101 — facilitator, tasks and participant; qualitative vs quantitative; moderated vs unmoderated; five participants for a typical qualitative study. Read 2026-11-19.
- Nielsen, J. Why You Only Need to Test with 5 Users. Nielsen Norman Group — typical L of 31%, five users found 85% of problems, and three studies of five rather than one large study. Read 2026-11-19.
Was this article helpful?
We use your answers to fix and expand this page.
Couldn’t send. Please try again in a minute.
Thanks for the feedback. We’ll use it to improve this page.You’ve already sent feedback on this page. Thanks.

Product Experience Specialist
Writes about product experience, practical workflows, and growth, turning complex processes into clear steps for everyday decisions.