Try it on your own data
Every report in this article is in the free plan. One snippet for web and apps, up to 10 sites.
Start freeWeb analytics tools fall into seven types: traffic, behaviour, heatmaps and replay, attribution, search performance, performance monitoring and app analytics. Choose by the question you cannot answer today, not by feature count. In the weighted example below, the same three candidates give two different winners for two sites, and the all-in-one suite scores lowest (59%) for the one that mostly needs sources and low privacy burden.
What you will learn
- Start from the questions you cannot answer today; each tool type answers different ones
- Weight your criteria before you see demos; the same candidates win for different sites
- Check raw-data export, sampling, retention, bot handling and price at 5x your traffic before features
Which question do you need your web analytics tool to answer?
Section updated
The best website analytics tools for you are the ones that answer the question you cannot answer today. Website analytics tools collect data on how people reach and use a website and turn it into reports; almost every tool answers the first question in the table below, and they differ a lot in the rest. Start from the question, and the tool type follows. If you are comparing specific products, jump to how to choose; for funnels, heatmaps or replay on their own, see funnel analytics tools, heatmap tools and session replay tools.
| Question | What answers it | Typical output |
|---|---|---|
| Where do visitors come from, and which pages do they read? | Traffic and audience analytics | Visitors, sources, pages, countries, devices |
| What do people do step by step, and where do they drop out? | Behaviour (event or product) analytics | Funnels, retention, paths, segments |
| Why did they leave on that page? | Heatmaps and session replay | Click maps, scroll depth, recorded sessions |
| Which campaign or channel brought paying customers? | Attribution and channel reporting | Conversions by source, cost per customer, return on spend |
| How is the site found in search? | Search-performance reports | Queries, impressions, clicks, average position |
| Is the site fast and error-free for real users? | Performance and error monitoring | Core Web Vitals, error counts |
| Can we measure without consent friction? | Privacy-first analytics | Aggregate counts without cross-site tracking |
No single type does all of this well. Suites claim to, but every item on the list needs different data collection and a different way of presenting it. That is why the question comes first: a tool with more features is only better if you use the extra ones. The basics of the discipline are in what web analytics is.
What are the main types of web analytics tools?
Seven types cover almost everything. For each, the main thing it cannot tell you is as useful as what it can.
| Type | Strength | What it cannot answer | Setup effort |
|---|---|---|---|
| Traffic and audience | Quick, simple view of visitors and sources | What people did inside the site beyond page views | Low: one script |
| Behaviour (event/product) | Funnels, retention, segments | Anything you did not send as an event | Medium: plan and send events |
| Heatmaps and session replay | Shows how a page is used | How many people behave this way | Low to medium; privacy review for recordings |
| Attribution and channel | Credits channels for conversions | Which ad creative to run; it measures, it does not bid | Medium: campaign tagging, cost imports |
| Search-performance | Queries and rankings before the click | What happens after the click | Low: connect your site |
| Performance and errors | Real-user speed and broken pages | Why users came | Low to medium |
| App analytics | Installs, versions, stability for mobile apps | Web behaviour unless the same project covers both | Medium: SDK in each app |
Two other things are often bundled with analytics but are separate jobs: A/B testing (changing what people see and comparing outcomes) and tag management (loading scripts). Check whether you need them before paying for a bundle.
How do you choose website analytics tools? Seven criteria
New section
Before you open any pricing page, answer these seven questions. They sort a long list of website analytics tools into a short one.
- What question do you need answered? Sources and pages need a traffic tool; drop-off needs events and funnels (funnel analytics tools); "why" needs heatmap tools or session replay tools.
- Are real visitors separated from bots? Search-engine and AI crawlers can inflate visits and push conversion rate down. Prefer a tool that reports them separately instead of silently deleting rows.
- Where is data stored, and what does it collect? Check region options, retention, and whether anything is written to the visitor's device (see the privacy section below).
- How deep are events and funnels? A page-view counter stops at "what was viewed"; product questions need custom events, funnels and retention (product analytics tools).
- What else is connected? Live chat, ad spend imports and search reports in the same project save a second script and a second login.
- How is price counted? Sessions, events, tracked people and seats scale differently; price it at five times your traffic (free website analytics shows what free tiers include).
- Can you take the data with you? Event-level export decides how hard the next switch is.
To see how popular products compare on these points, use web analytics comparison.
How do you compare tools for your situation? A worked example
A feature list does not choose for you. Weight the questions that matter to you, score each candidate on how well it fits, and compare totals. Sample data: three tool profiles are scored from 0 (poor fit) to 3 (good fit) on six criteria, where for setup effort and cost a higher score means easier or cheaper.
| Criterion | Simple traffic counter | Event and product analytics | All-in-one suite |
|---|---|---|---|
| Traffic sources | 3 | 3 | 3 |
| Page drop-off before purchase | 1 | 3 | 3 |
| Campaign return | 1 | 2 | 3 |
| Privacy and consent load | 3 | 2 | 1 |
| Setup effort | 3 | 2 | 1 |
| Cost at 100,000 sessions | 3 | 2 | 1 |
Now weight the criteria for two different sites (each weight from 1 to 5):
- Online store: sources 5, page drop-off 5, campaign return 4, privacy 2, setup 3, cost 3. Total weight 22, maximum score 3 × 22 = 66.
- Privacy-sensitive publisher: sources 5, page drop-off 1, campaign return 1, privacy 5, setup 3, cost 3. Total weight 18, maximum score 3 × 18 = 54.
Weighted score = sum of weight × score for each criterion.
| Simple traffic counter | Event and product analytics | All-in-one suite | |
|---|---|---|---|
| Store | 5×3 + 5×1 + 4×1 + 2×3 + 3×3 + 3×3 = 48 (73%) | 5×3 + 5×3 + 4×2 + 2×2 + 3×2 + 3×2 = 54 (82%) | 5×3 + 5×3 + 4×3 + 2×1 + 3×1 + 3×1 = 50 (76%) |
| Publisher | 5×3 + 1×1 + 1×1 + 5×3 + 3×3 + 3×3 = 50 (93%) | 5×3 + 1×3 + 1×2 + 5×2 + 3×2 + 3×2 = 42 (78%) | 5×3 + 1×3 + 1×3 + 5×1 + 3×1 + 3×1 = 32 (59%) |
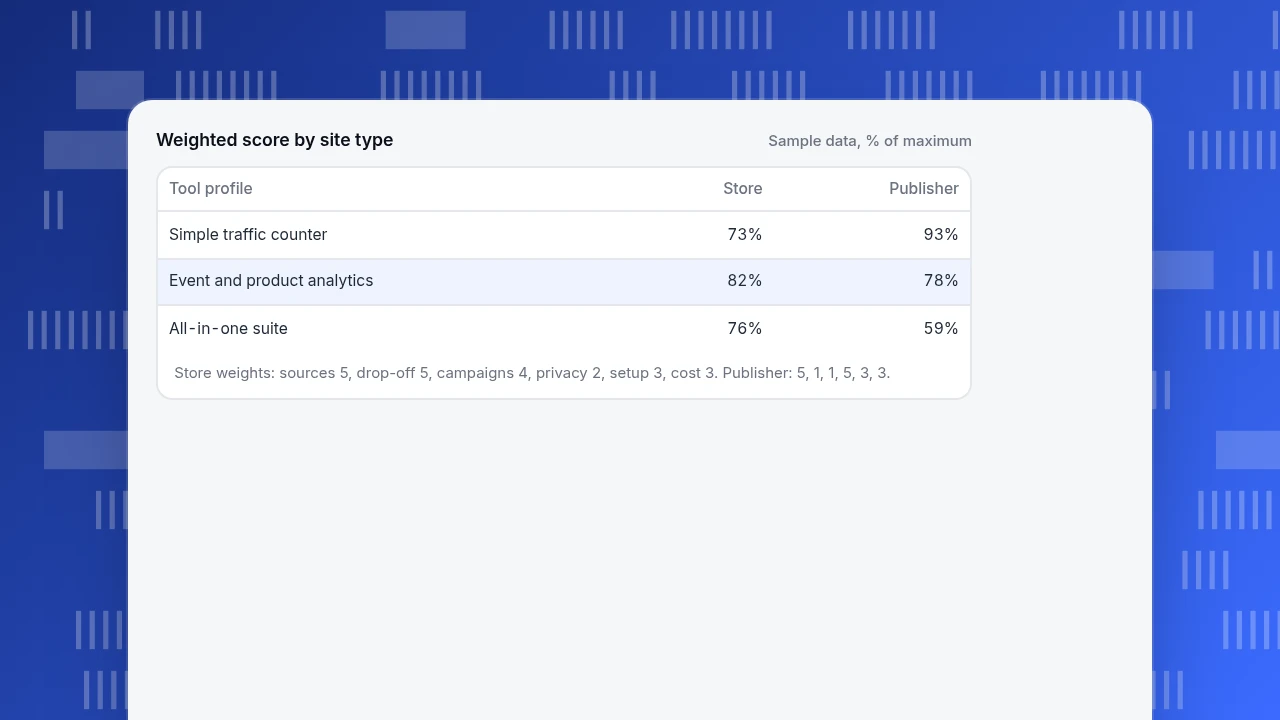
The same three candidates give two different winners. The store needs funnels and campaign reporting, so event analytics wins at 54. The publisher mostly needs sources and low privacy burden, so the simple counter wins at 50 and the all-in-one suite comes last at 32. Note that the suite has the highest feature count and the lowest score for the publisher. The point of the exercise is not the numbers but that you wrote the weights down before looking at demos.
Weighted score by site type
Sample data, % of maximum| Tool profile | Store | Publisher |
|---|---|---|
| Simple traffic counter | 73% | 93% |
| Event and product analytics | 82% | 78% |
| All-in-one suite | 76% | 59% |
Store weights: sources 5, drop-off 5, campaigns 4, privacy 2, setup 3, cost 3. Publisher: 5, 1, 1, 5, 3, 3.
What should a selection checklist include?
Beyond features, ask the following. Each one has caused real migrations.
| Check | Why it matters | What a good answer looks like |
|---|---|---|
| Who owns the raw data? | You may want it elsewhere later | Export of event-level data, not only reports |
| Is data sampled? | Sampling changes totals (data sampling) | Counts are exact for your volume, or sampling is disclosed |
| How long is data kept? | Year-on-year comparisons need history | Retention matches your reporting cycle |
| Are bots filtered or separated? | Bots inflate sessions and depress conversion rate | Recognised bots reported separately |
| What are the consent and cookie requirements? | Legal exposure and the share of visitors you lose | Behaviour documented for your regions |
| How is price counted? | Sessions, events, tracked people and seats scale differently | A price you can predict at double your traffic |
| Can events and users be identified? | Needed for retention and customer-level views | Login-based identity, not only anonymous IDs |
| Do apps and the web share one data model? | Separate tools split the customer journey | One project or at least one user ID |
| Can others read the reports? | Reports nobody sees do not change decisions | Read-only sharing, scheduled delivery |
Implementation details such as tagging, goals and naming rules are in how to implement web analytics, and the habits that keep the data trustworthy are in web analytics best practices.
| Question | Tool type | Cannot answer |
|---|---|---|
| Where do visitors come from? | Traffic and audience | What people do inside the site |
| Where do people drop out? | Behaviour (event/product) | Anything not sent as an event |
| Why did they leave? | Heatmaps and replay | How many behave this way |
| Which campaign paid back? | Attribution and channel | Which creative to run |
Suites cover several rows, but each row needs different data.
What does "free" web analytics really cost?
Free tiers are real, but the price is paid in other ways. Check these before assuming free means free.
- Volume limits. Many free tiers cap sessions or events per month. A site that grows 3× in a year can cross the cap. If the cap is 10,000 monthly sessions and you get 12,000, you either pay, lose data or get sampled results.
- Short retention. The free tier may keep detailed data for only a few months, which breaks year-on-year comparisons.
- Fewer features. Funnels, exports, raw-data access or team seats are common paywalls.
- Your time. Self-hosted analytics has no licence fee but costs hosting, upgrades and security work. Sample figures: 2 hours of maintenance a month at $40 an hour is $80 a month, which may exceed a small paid plan.
- Data use. Read how the provider may use the data collected on your site, not only what you can see in reports.
"Free" is a good starting point for a small site. The question is what happens at 5× your current traffic, so run the price at that volume before you commit.
How do privacy rules affect the choice?
If you have visitors in the EU or UK, storing or reading anything on a visitor's device (a cookie, local storage, a device fingerprint) generally needs consent under the ePrivacy Directive, Article 5(3), unless it is strictly necessary to provide the service the visitor requested. That rule is about the device access, not about whether analytics is useful, which is why tools differ so much here:
- Tools that rely on cookies or persistent IDs typically need a consent banner, and visitors who decline are missing from the numbers.
- Tools that count visits without storing anything on the device may avoid that trigger, but you should still check the full legal basis for your own situation; this article is not legal advice.
- Whatever you choose, document what the tool collects, where it stores it and how long it keeps it.
The trade-offs of counting without cookies are in cookieless analytics explained, and the definition is in privacy-first analytics.
How do you switch tools without losing the thread?
Numbers will differ between any two tools, because they define visitors, sessions and bots differently. Run both for 2 to 4 weeks, reconcile, then switch.
- List what you actually use. Export the five reports someone opens each week; ignore the rest.
- Map events and goals. Write old name and new name side by side before you tag anything.
- Run both in parallel for at least two full weeks, including a weekend.
- Reconcile the totals. Sample data: the old tool reports 10,000 visitors in a week. It counted 700 bots as visitors (−700), leaving 9,300 people. The new tool's script was blocked or loaded late for 400 of them (−400). The new tool reports 8,900, and the gap is explained: 10,000 − 700 − 400 = 8,900. An unexplained gap above about 5% means a tagging problem.
- Mark the switch date on your charts so a later trend break is not read as a real change.
- Keep read-only access to the old tool for historical comparisons; history generally cannot be imported one-to-one because definitions differ.
Common mistakes when choosing web analytics tools
- Choosing by feature count. In the example, the suite with the most features scored lowest for the publisher.
- Installing several tools for the same question. You will get several answers and trust none of them.
- Treating default reports as a measurement plan. Decide the five numbers that drive decisions first; see web analytics best practices.
- Ignoring bots. If the tool does not separate them, your conversion rate is lower than reality.
- Comparing numbers across tools. Two tools disagree by design; compare each tool against itself over time.
- Forgetting the exit. If you cannot export event-level data, switching later means starting from zero.
- Collecting everything. More data means more consent burden, more cost and slower reports. Send the events you will use.
How does TapCub fit into this choice?
Section updated
Disclosure: TapCub is our own product, so treat this section as the author's view and check every claim against the web analytics page and pricing. It is built for a particular combination: web, app and mini-program analytics plus live chat on one script. This is how a store following the checklist above would use it, and where it stops.
- Start with the traffic questions. Web analytics › Overview, Sources and Pages answer where visitors come from. Recognised bots and AI crawlers are counted separately under Web analytics › Bots, so they do not inflate visitors or deflate conversion rates. Visitors that arrive from AI assistants can be read as a traffic channel, separate from the crawlers that fetch your pages.
- Add behaviour when you need it. All-platform analytics › Behavior › Behavior analysis holds funnels, retention and paths on the same data. For the "why did they leave" question, Heatmaps and Session replay exist; session replay is off by default and must be switched on.
- Bring spend in for campaign return. All-platform analytics › Business › Channel ROI accepts imported spend by day, channel, source or campaign and shows cost per click, cost per customer and return on ad spend.
- Pick the privacy level. Configuration › Privacy center sets the collection tier, region rules and retention. Whether consent is needed depends on that configuration and local law.
- Check the free plan against your needs. As listed on pricing on 2026-11-21, the free analytics plan covers 10 websites, apps or mini-programs, 500,000 events a month, 6 months of retention and 3 funnels, with no time limit; live chat has its own free tier (1 agent seat, 100 conversations a month). Paid plans start at $9 a month for analytics. Plans change, so confirm on the page.
- Know what it does not do. TapCub does not run A/B tests or split traffic, does not bid on ads, and does not import another tool's history one-to-one, so keep read-only access to the old tool. It is not a heatmap-only or replay-only specialist either. Search queries and rankings come from connecting Search Console or Bing Webmaster under Monitoring › Search performance.
FAQ
What are web analytics tools?
Web analytics tools collect data on how visitors reach and use a website and present it as reports: visitors, sources, pages, conversions and, in some tools, behaviour such as funnels and retention. They differ in what they measure and how they handle privacy, data ownership and price.
What are the types of web analytics tools?
The main types are traffic and audience analytics, behaviour (event or product) analytics, heatmaps and session replay, attribution and channel reporting, search-performance reports, performance and error monitoring, and app analytics. Choose by the question you need to answer.
How do I choose a web analytics tool?
List the questions you cannot answer today, weight them, and score candidates on fit, effort, price at your expected traffic and privacy load. Check raw-data export, sampling, retention and bot handling before features. Run a trial alongside your current tool for a few weeks.
Is there a free web analytics tool?
Yes, several. Free tiers usually limit sessions, retention or features, and self-hosting trades licence fees for your own maintenance time. Work out the cost at five times your current traffic before relying on a free plan.
Do I need more than one web analytics tool?
Often one is enough for a small site. Add a second only for a separate question, such as session replay or search performance, and never run two tools for the same question. If you do compare two, expect the totals to differ and reconcile them by bots, blocked scripts and definitions.
See also: Open Source Analytics: Licence, Hosting and Data Protection Costs.
See also: Free Website Analytics: What the Free Tiers Actually Include.
See also: Website Traffic Analysis Tools: What Each Type Answers.
See also: Google Analytics Alternatives: Pick by the Question You Need Answered.
Sources
- European Union. Directive 2002/58/EC (ePrivacy), Article 5(3) — consent for storing or accessing information on a user's device, with the strict-necessity exception. Checked 2026-11-19.
- web.dev (Google). Web Vitals — definition of Core Web Vitals as real-user performance metrics. Checked 2026-11-19.
Update history1
- UpdateTightened the opening answer, added a seven-criteria how-to-choose section, internal links to related tool guides, and a disclosed TapCub section with free-plan details checked on 2026-11-21.
- First published
Was this article helpful?
We use your answers to fix and expand this page.
Couldn’t send. Please try again in a minute.
Thanks for the feedback. We’ll use it to improve this page.You’ve already sent feedback on this page. Thanks.

Data Engineer
Writes about event design, data quality, and collection workflows, with verifiable implementation methods for reliable analytics.