Try it on your own data
Every report in this article is in the free plan. One snippet for web and apps, up to 10 sites.
Start freeSession replay software records what a visitor did on a page and plays it back as a reconstruction, so you can see why one person struggled. It is a qualitative tool: use numbers to find the anomaly, filter to the affected sessions, then watch about 20 recordings to learn why. Below: scenarios, sampling maths, privacy and how to choose.
What you will learn
- Find the problem with a funnel or error count first, then watch replays of exactly those sessions
- Watching about 20 filtered sessions finds a cause hitting 15% of them with 96.1% probability, but it cannot size the cause
- Mask inputs, exclude sensitive pages, sample and keep recordings briefly
What does session replay software actually record?
Session replay software records what a visitor did on a page (clicks, scrolls, typing, page changes) and plays it back as a moving reconstruction. It is not a screen video. The page script sends a stream of events and the player rebuilds the page from them. A university study of these scripts described them as sending keystrokes, mouse movements, scrolling and the full contents of pages to a server, which is exactly why they are useful and exactly why they need care.
Two things follow from that. First, a replay shows one person's path, so it can explain a problem but cannot size it. Second, whatever is on the page can end up in the recording unless it is masked. Both points drive the rest of this guide. For the short definition see session replay; for the click pattern replays most often reveal see rage click.
When is a replay the right tool, and when is it not?
Replays answer "what happened to this person?" Counts answer "how many people?" The table pairs common situations with where to start.
| Situation | Start with | Then use replay to |
|---|---|---|
| One funnel step loses far more people than the others | Funnel step conversion | See what those people did on that step |
| A page has many repeated clicks on one spot | Click heatmap, frustration clicks | Watch what the person expected to happen |
| Errors rose after a release | Error counts by page | See the clicks that led to each error |
| A customer says "checkout didn't work" | Their user profile and session | Confirm what they saw |
| You want to know which headline wins | A controlled test | Not suited: replay cannot rank two designs |
| You want to know how many people hit a bug | Event counts | Not suited: you watch a sample, not a population |
The rule: find the anomaly with numbers, then watch replays of exactly those people to learn why. Watching random sessions first is slow and mostly shows people behaving normally. The friction ideas in user friction cover what to look for once you are watching.
How many sessions do you need to watch?
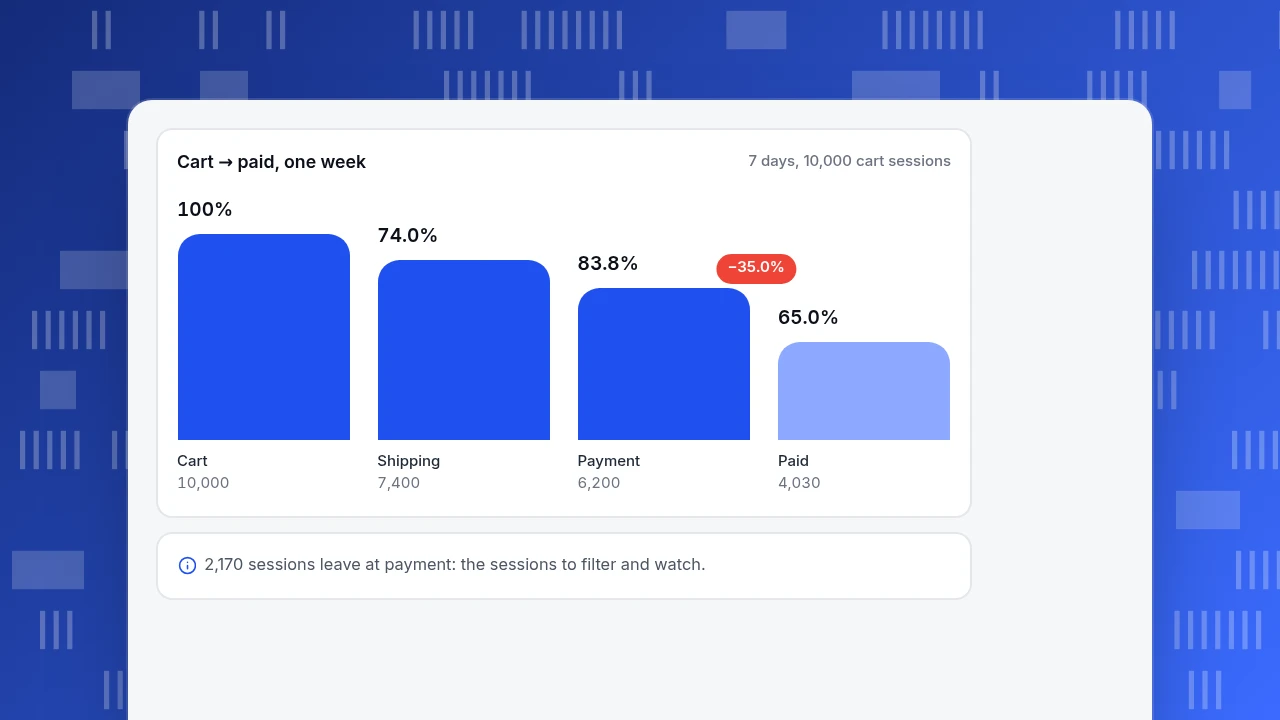
Watching feels unscientific, but you can reason about it. Sample data: a store sees this funnel over a week.
| Step | Sessions | Step conversion |
|---|---|---|
| Cart | 10,000 | n/a |
| Shipping | 7,400 | 7,400 ÷ 10,000 = 74.0% |
| Payment | 6,200 | 6,200 ÷ 7,400 = 83.8% |
| Paid | 4,030 | 4,030 ÷ 6,200 = 65.0% |
The payment step loses the most: 6,200 − 4,030 = 2,170 sessions, a 35.0% drop. Now the replay maths:
- Recording every session is rarely sensible. With a 10% sample, those 2,170 lost sessions give about 2,170 × 10% = 217 recordings.
- Filter to recordings with frustration clicks or errors. If 24% qualify, that leaves 217 × 24% ≈ 52 to choose from.
- Suppose one cause affects 15% of those sessions. The chance that a random watch of n sessions shows it at least once is 1 − 0.85^n: 10 sessions give 80.3%, 20 give 96.1%, 30 give 99.2%.
So watching about 20 well-chosen sessions is usually enough to find a cause that hits one session in seven. It is not enough to say how common it is. Once you have a hypothesis ("the card field rejects spaces"), measure it with an event and the funnel, not with more watching.
Cart → paid, one week
7 days, 10,000 cart sessionsCart
10,000
Shipping
7,400
Payment
6,200
Paid
4,030
How is replay different from heatmaps and funnels?
The three tools sit on one ladder from many people to one person.
| Tool | Unit | Good at | Weak at |
|---|---|---|---|
| Funnel | Many people, one path | Where people leave, how many | Why they leave |
| Heatmap | Many people, one page | Where clicks and scrolls concentrate | Order of actions, individual intent |
| Session replay | One person, one visit | Why, in sequence | How many, and whether it generalises |
Use the funnel to choose the step, the heatmap to choose the element, and the replay to understand the behaviour. The same logic of moving from numbers to a person is in funnel analysis mistakes from the other direction.
What does session replay do to visitor privacy?
Recording behaviour is personal-data processing, and the failure modes are well documented. A Princeton study of seven replay services found them on 482 of the top 50,000 sites it crawled, a figure the authors call a lower bound. It found that text typed into forms was collected before the visitor submitted it, that some password boxes were not hidden by default, that some services masked only certain input types, and that none redacted displayed page content by default. In its test cases that meant payment details and medical information on the page ended up in recordings.
Under the EU General Data Protection Regulation, personal data must be limited to what is necessary (Article 5(1)(c)) and kept no longer than needed (Article 5(1)(e)). Neither is a recipe for replay settings, but both point the same way. This is not legal advice; check your own obligations.
A practical checklist:
- Mask all input fields and keep passwords out entirely.
- Exclude sensitive pages (payment, identity, health, account settings) from recording rather than trying to mask them piece by piece.
- Consider masking all text on pages that display personal data.
- Sample. A 10% sample is enough for diagnosis and records ten times fewer people than recording all.
- Keep recordings briefly. Thirty days is plenty to investigate a release.
- Tell visitors in your privacy policy what is recorded, why and for how long, and respect consent rules where they apply.
- Limit who can watch and be able to delete one visitor's recordings on request.
| Setting | Why it matters | Starting value |
|---|---|---|
| Input masking | Typed text is collected before a form is submitted | On, always |
| Excluded pages | Safest control for payment, identity and health pages | Add every sensitive path |
| Sampling | Fewer people recorded, enough for diagnosis | 10% or lower |
| Retention | Less data held for less time | 30 days |
| Who can watch | Recordings can contain personal data | Few named people |
| Deletion | Access and erasure requests | Delete by visitor |
These are starting points, not legal advice; adjust to your own obligations.
How should you choose session replay software?
Skip feature lists and test these points on a real page of yours:
| Question | Why it matters | How to test |
|---|---|---|
| Does it cover web only, or apps too? | Web and app replay need different techniques | Check platform support for every product you run |
| Are inputs masked by default, and can you mask by area? | Prevents the failures above | Type fake card details and watch the recording |
| Can you exclude whole pages? | The safest control | Add a path and confirm nothing records there |
| Can you filter to sessions with errors or frustration? | Turns hours of watching into minutes | Filter, then open three results |
| What is the sampling and retention control? | Cost and exposure | Read the settings, not the pricing page |
| Does it connect to your analytics? | You need to move between counts and recordings | Open a recording from a session or funnel step |
| Can you delete by visitor? | Access and erasure requests | Find the delete path |
What mistakes make replay useless?
- Watching without a question. Without a funnel step, error or page to investigate, you collect anecdotes.
- Treating one recording as a finding. One clip proves it can happen. Count it before you fix it.
- Skipping the pre-filter. In the example, filtering cut 217 recordings to about 52 worth opening.
- Recording sensitive pages "just in case". Exclusion is cheaper than a clean-up.
- Forgetting replay is web-based here. A mobile app problem needs a different tool.
- Fixing the first thing you see. Check on the heatmap and funnel that it is the cause.
How do you use session replay in TapCub?
Take the payment-step example above and run it in TapCub. TapCub's replay is off by default and records websites only (not apps or mini programs).
- Find the step. In All-platform analytics › Behavior › Behavior analysis, build the cart-to-paid funnel. TapCub shows each step's count, step conversion and drop, and flags the step that loses most. Click the step to see who dropped there.
- Turn replay on carefully. In All-platform analytics › Behavior › Session replay, open the Settings tab (administrator or owner). Enabling asks you to confirm that your privacy policy discloses recording, that sensitive pages are excluded and that input masking stays on. Defaults: 10% sampling, inputs masked, all-text masking off, 30-day retention. Add payment and account paths to the exclusion list; password fields and the chat widget are never recorded.
- Filter and watch. The list shows entry page, duration, pages, frustration clicks and errors per session. Filter to sessions with errors or frustration clicks, narrow by path prefix, then open a recording. The player runs at 1x to 8x, skips idle time, and has an event timeline of page views, events and errors.
- Go back to numbers. Check All-platform analytics › Behavior › Heatmaps for frustration clicks on the page, make the fix, then re-run the funnel to see the step conversion change.
TapCub does not run A/B tests, so judge the fix by comparing the step before and after. If you also use a separate replay service, a link template in Web analytics › Configuration › Web settings adds a "view replay" link on each session.
FAQ
What is session replay software used for?
It shows what a visitor did on a page so you can understand a problem that numbers have already flagged: a funnel step with high drop-off, repeated clicks on one element or a rise in errors. It explains behaviour for individual visits; it does not tell you how common a problem is.
Is session replay a video of the screen?
Usually not. Tools record page events such as clicks, scrolls, typing and page changes, then rebuild the page in a player. That makes recordings small, but it also means whatever is on the page can be captured unless masked or excluded.
Is session replay legal?
It depends on where you operate, what you record and how you inform visitors. It processes personal data, so data-minimisation and retention rules such as those in GDPR apply, and consent may be needed in some regions. Mask inputs, exclude sensitive pages and take legal advice for your case.
How many sessions should I watch?
Enough to find the cause, not to measure it. In the sample, watching 20 filtered sessions finds a cause affecting 15% of lost sessions with 96.1% probability. Then measure the suspected cause with an event or funnel.
Does session replay slow down a website?
It adds a script and sends data in batches, so sampling and excluding pages reduce the load. Check the tool's documentation for its size limits and test page speed with replay on before enabling it everywhere.
See also: Heatmap tools: 8 criteria to compare before you choose.
Sources
- Steven Englehardt, Gunes Acar and Arvind Narayanan. No boundaries: Exfiltration of personal data by session-replay scripts. Princeton CITP, 2017: 482 of the top 50,000 sites, input and content masking failures.
- European Union. General Data Protection Regulation (EU) 2016/679, Article 5(1)(c) data minimisation and 5(1)(e) storage limitation.
Was this article helpful?
We use your answers to fix and expand this page.
Couldn’t send. Please try again in a minute.
Thanks for the feedback. We’ll use it to improve this page.You’ve already sent feedback on this page. Thanks.

Data Analyst
Explores traffic sources, conversion funnels, and retention, using clear metric definitions and concrete examples to explain what the numbers mean.